
|
|
News Briefs, Back Issues, Advertise, Contact, Subscribe/Unsubscribe If, for some reason you cannot read this document, visit: http://www.gismonitor.com/news/newsletter/archive/101305.php
Editor's Introduction 
Imagery For the Katrina Relief Effort
In the relief efforts in response to Hurricane Katrina, imagery has played a key role and DigitalGlobe's QuickBird satellite has been a major provider. Obtaining the imagery, however, is only the first step. Next, it has to be processed and put to use. Several academic and commercial organizations quickly teamed up to do this. Among them, San Diego State University (SDSU) partnered with the California Institute for Telecommunications and Information Technology (Calit2) and ImageCat with Risk Management Solutions (RMS). *** This week I spoke with Eric Frost, co-director, with Bob Welty, of SDSU's Viz Center, which is designed to disseminate massive amounts of data simultaneously and is capable of accommodating millions of Web access requests per day during an emergency. The Viz Center is part of the futuristic OptIPuter network, which is led at Calit2 by Larry Smarr, one of the pioneers in the use of the Internet and head of NASA's Earth System Science Advisory Board. The OptIPuter ("optical" and "computer" with IP in the middle) and the National Lambda Rail are National Science Foundation-supported efforts to do exactly this transport of huge files over the nation's fiber backbone to invent the future of the Internet. SDSU uses this network at 1 GigE, waiting to be upgraded to 10 GigE, to connect a series of servers — including SGI Prism, Sun Zulu graphics server, and Sun 16-blade server — to each other and to the San Diego Supercomputer Center [www.sdsc.edu] and direct connect onto the Internet backbone.Operating under Calit2's umbrella, Frost and his team, "gather whatever data is available and put it in a special format," he told me. "The first imagery to arrive was from the National Oceanographic and Atmospheric Administration (NOAA), which collected 5,000 images in a single day." The U.S. Geological Survey, the Army Corps of Engineers, and NASA collectively provided many terabytes of imagery. "NOAA," Frost told me, "very wisely figured out that they could fly their plane all day long to take images and that we and others could process the images and serve them back to them or anyone else." This division of labor takes advantages of each organization's strengths: the computers at Frost's Center are able to do in days the geometric processing and color-balancing that would take NOAA "far longer time." "So NOAA is forming partnerships and it doesn't cost the government anything because it is all done by volunteers. NOAA has been a real hero in this by collecting critical data and seeing how to use the data to the nation's advantage in very clever ways." Frost's team, led by the Viz Center's Senior Research Scientist, John Graham, began processing some of the datasets before Katrina even made landfall. Much of this work, Frost told me, was specifically intended to assist the American Red Cross, whose chief information officer and senior VP, Steve Cooper, "was very aware that the need [for imagery] was going to be great." Frost's team also worked closely with NIUSR and the National Institute of Environmental Health Sciences (NIEHS), both of which he praises highly. "NIUSR, led by Lois Clark McCoy, was a sparkplug in connecting people, needs, and functionality because of their wisdom in having done this in many difficult situations. This social network is extraordinarily valuable, as is the willingness of their members to serve the nation in times of need." When a disaster strikes, he told me, there's an informal network of professionals who assist each other, "and you don't even talk about money, because we know that there is no money [for this kind of work]. We had done the same work for Banda Aceh. Some of the same doctors [who assisted with relief after the tsunami hit Banda Aceh] were on the ground in the areas his by Hurricane Katrina and saying 'We need the data!'" I asked Frost how many people are on the team and where they are located. He told met that the team consisted of "about 25 very gifted people all over the country who have come together to do image processing and GIS analysis." They log into the Center's computers and use its processing power and Internet connectivity. Frost describes the team's collaboration style as "stone soup." The team's principal contribution to the relief effort has been to geometrically process and color balance the images it received and put them into GeoMatrix. This is a format developed by GeoFusion that allows very large image files to be served efficiently over the Internet and viewed using a Web browser with a 2 MB extension, i.e. a very thin client. At an average size of about 150 to 200 MB each, thousands of images amount to terabytes of data and would be otherwise virtually inaccessible due to the enormous download times involved. "The imagery was the base layer," Frost told me. "On top of that we did the GIS. We are using the raster base on which you can put the GIS to manage the disaster and relief effort. We gathered as many of the GIS layers available as possible and are serving them up. We gathered imagery for many, many days. This will be a continuous, long-term effort. We are trying to do everything in an OGC-compatible, one-stop geospatial format. Hopefully that really empowers people and anybody can come get these data sets. We are really focused on how you can deliver this stuff in a way that is more standards-based. This is where ESRI is likely to be in a couple of years — with a stack of new tools for GIS, visualization and Internet serving." Frost told me that his Center has a very good relationship with ESRI and sees its work as complementary to ESRI's. "We have a lot of students there. They are very attentive and picking up well on all [the development work that we are doing]." Frost's team helped GeoFusion serve images of the hurricane disaster from a website that the company had previously set up to serve, among other things, images transmitted by the Mars lander and of the effects of the tsunami on Banda Aceh. Frost describes the layers available through the website as "onion skins:" after picking which data sets to turn on, slider bars allow you to adjust the mix of layers. This onion-skin capability allows you to put GIS on raster, but also multiple times over each other, like before and after with fade into each other to see damage easily, or weather over surface, or surface over subsurface data sets. Frost describes in glowing terms ("Absolutely incredible!") the work done by colleagues who recognized the urgent need to automate much of the image processing work and during the Katrina relief effort wrote the software to do so. "[Image processing] is now 600 times faster than it was at the beginning of Katrina," he told me. He credits this vast improvement to "a lot of careful work" to analyze the elements of image processing. "This is an extraordinary team, led by John Graham, Norm Vine, Chuck Stein." The Viz Center uses an SGI Prism, ("a magnificent machine," says Frost) with 10 terabytes of local disk space, 8 CPUs, and 24 gigabytes of RAM. "Now we have two: one at SDSU and a clone at Calit2 purchased by Tom DeFanti, their network architect. It looks like it's one CPU, so you can process these huge files very efficiently. Being able to process and serve the data this efficiently means that you can use far more data and thus better serve the needs of the decision makers and people impacted by the disaster." "The power of the GIS and remote sensing community is absolutely enormous in disasters," Frost told me. "GIS has really helped in a very profound way. The GIS community is one of the groups of people that made a huge contribution. Linking the pieces of the system (data acquisition, archives, processing, visualizing, serving) to each other via 10 GigE optical networks would profoundly empower the nation's ability to use computing and GIS/remote sensing expertise for the benefit of our country and world."
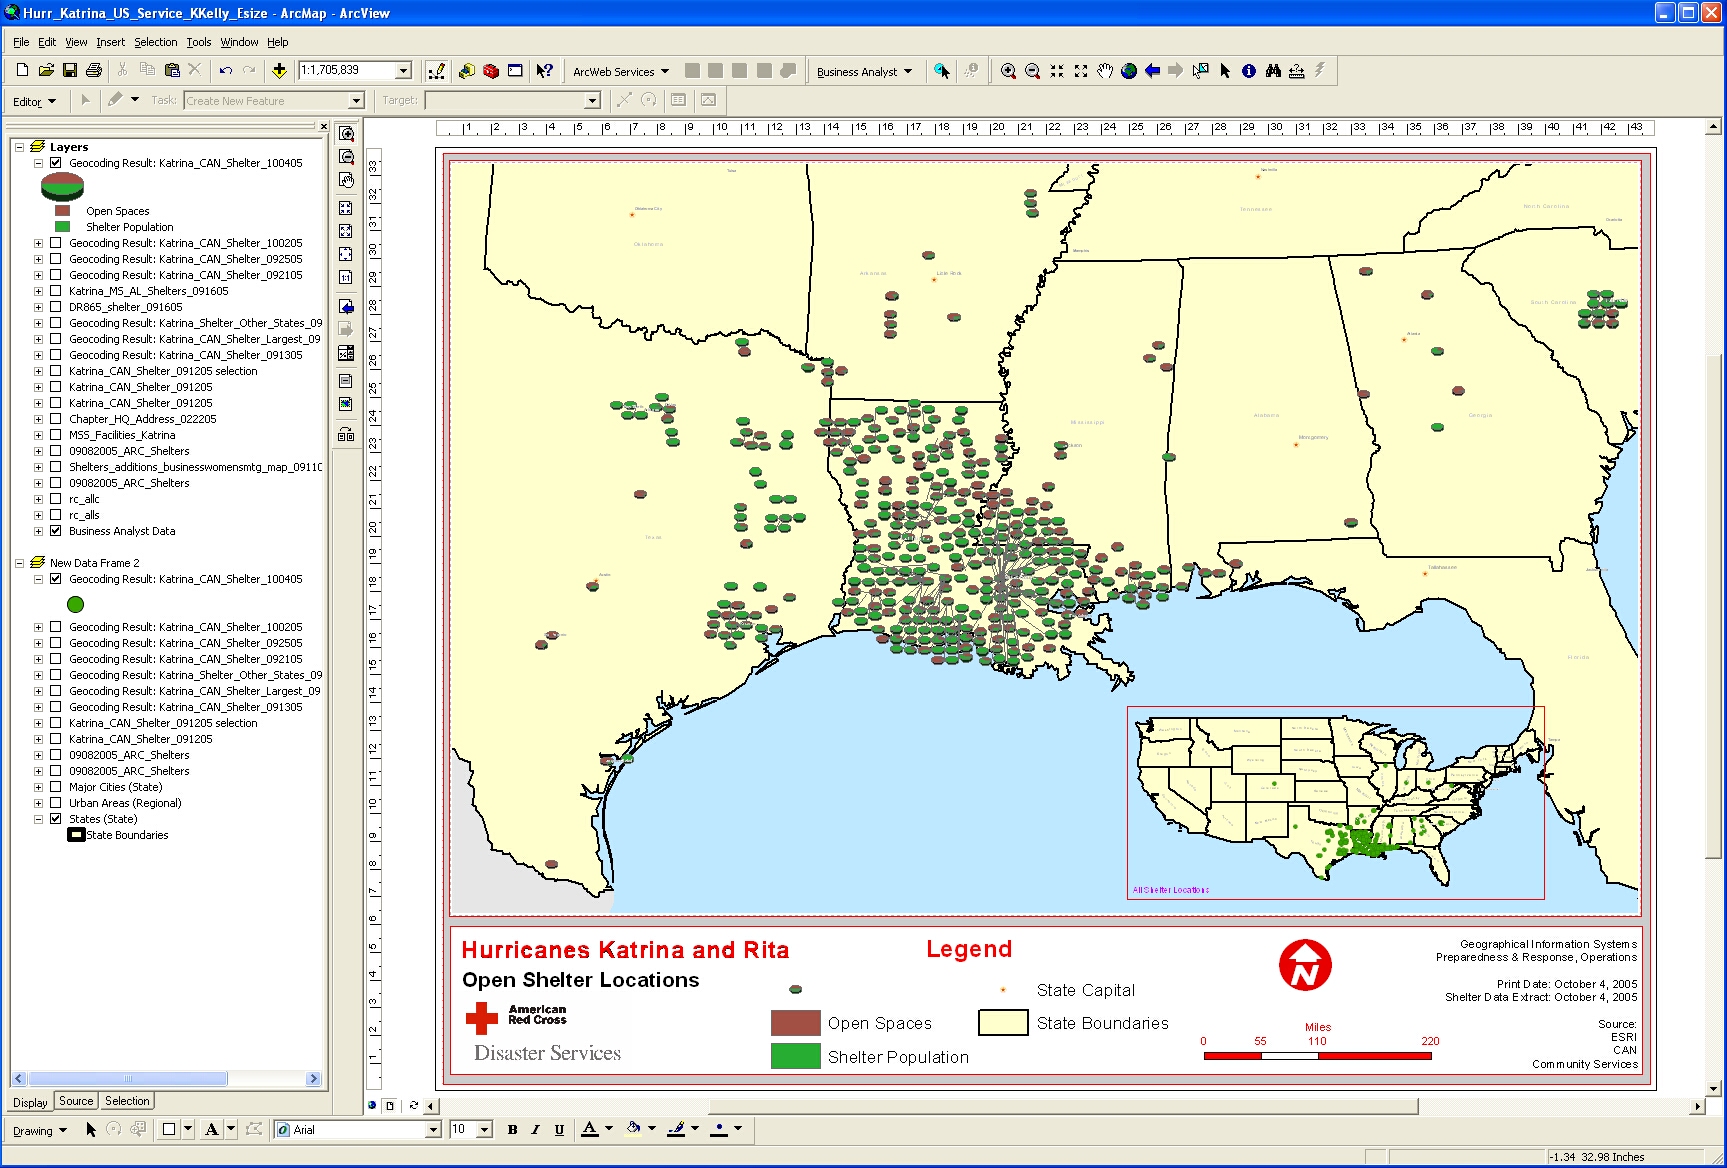
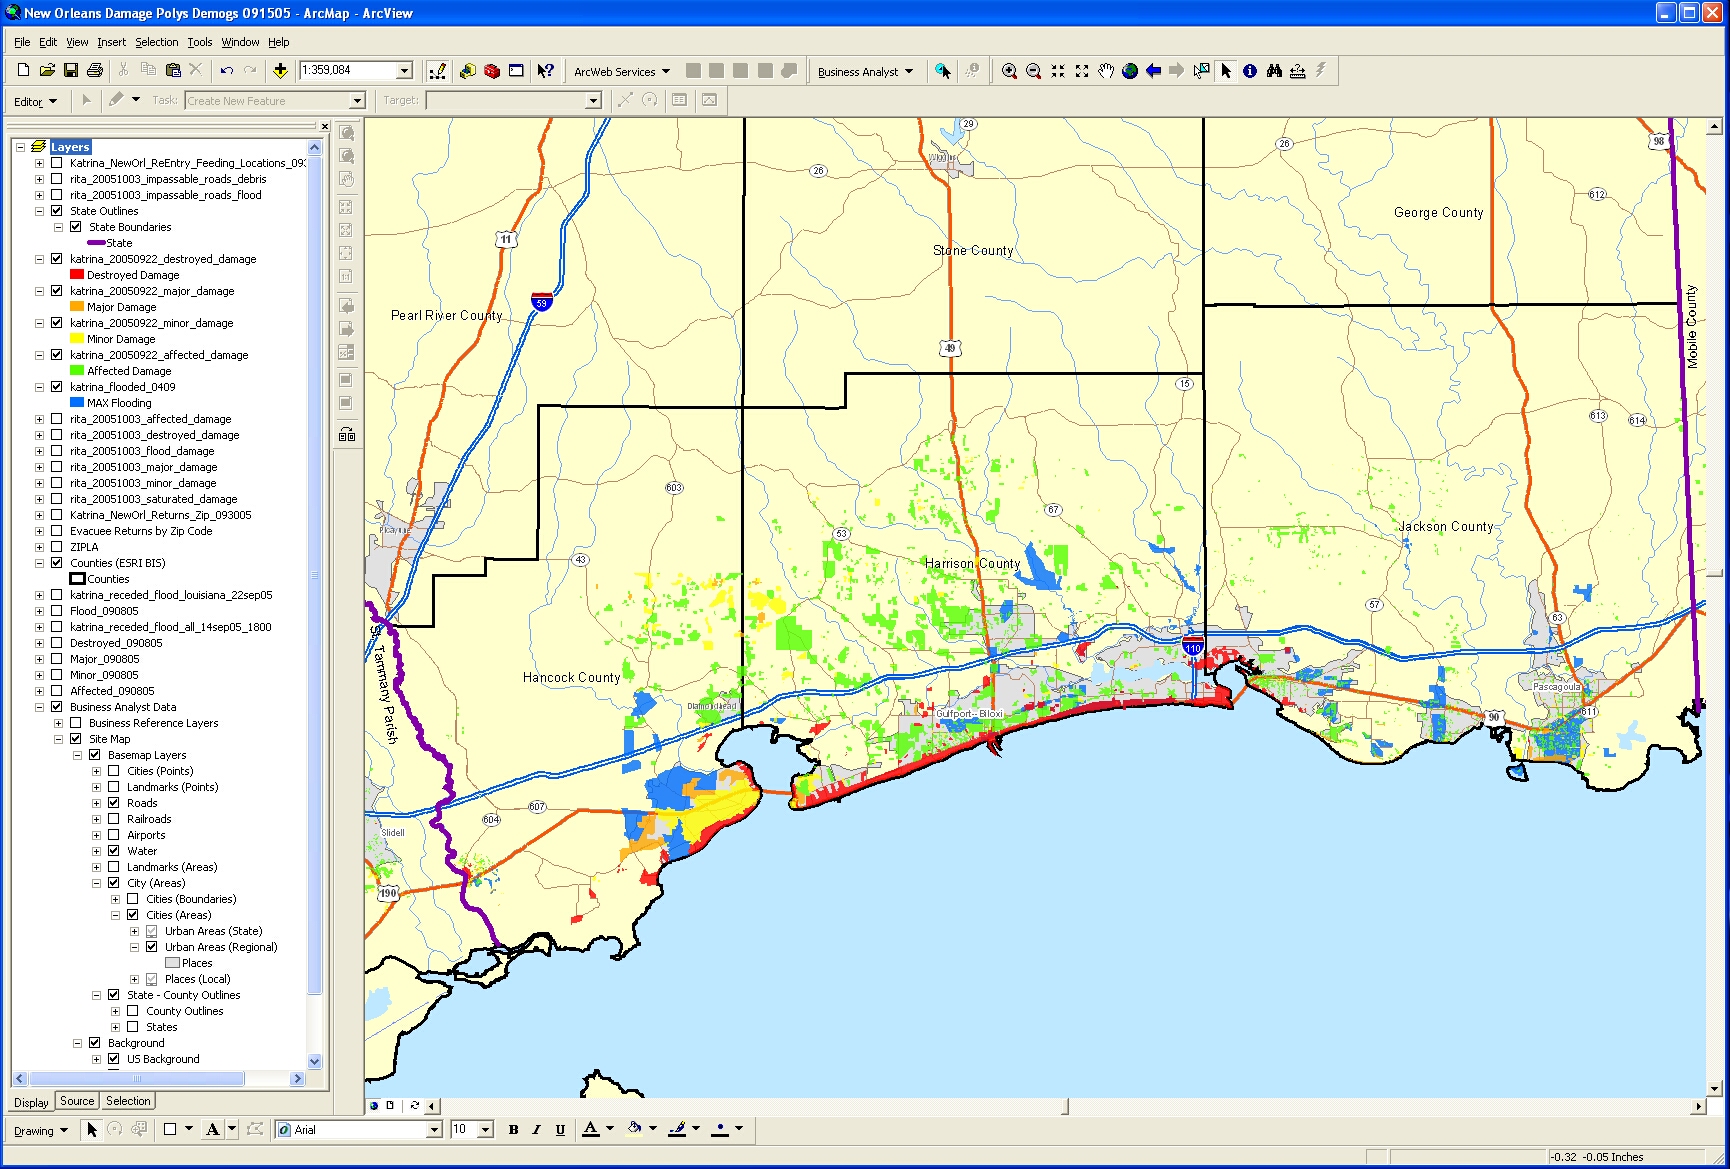
This week I also spoke with Greg Tune, lead program manager for disaster assessment and GIS at the American Red Cross. He runs a two-person shop and uses the full suite of ESRI products, including Business Analyst. "The demographic piece is very important to us from a business standpoint," he told me. "We create a lot of thematic maps that we print in various formats, from 81/2 to large. We post many of them on our intranet, as JPGs and PDFs. We also post a lot of our desktop thematic maps (e.g. of shelters and of feeding and service facilities) on ArcIMS sites, so that workers at our more than 800 chapters can see what we are doing in the field and how resources are impacted."
One important sub-theme of the book is the key role of standards. For each case study the authors specify both the software and the standards used and repeatedly make the point that the development of standards and of portals has been synergistic. For example, they write that "Geospatial One-Stop has built on the work of other projects and initiatives. This includes the long-running and influential work of the Federal Geographic Data Committee (FGDC), which is responsible for defining and promoting NSDI and standards for metadata." The authors marvel at the speed at which large and complex portals have been built: "Many organizations had their portals up and running in a matter of months." They immediately go on to explain why: "Spatial portals are based on familiar Internet and GIS technology [that is] tried, tested, robust, and well understood." On the role of spatial portals during disasters, Tang and Selwood write: "Within hours of a disaster, a spatial portal can build a virtual project library from data and resources located all over the world." In the case of Hurricane Katrina, for example, Geospatial One-Stop set up a Hurricane Disaster Viewer. However, contrast this with the comment on this topic by Greg Tune, which I report elsewhere in this issue. Spatial Portals is considerably enhanced by ten full-page diagrams, about 70 screen shots, and a glossary with 48 entries. Perhaps the only shortcoming of Tang and Selwood's enthusiastic paean for spatial portals is that it makes only passing reference to the risks of misuse and misinterpretation of geographic data by untrained users of spatial portals — a subject that merits considerably more attention. Finally, they seem to beg an obvious question: if each and every portal aspires to be a "one-stop shop," is it not a problem that more such "shops" continue to spring up, often with overlapping inventories? *** Dr. Winnie Tang holds a doctoral degree in GIS from the University of Hong Kong and is CEO of ESRI China (Hong Kong) Ltd. She is also the co-author of Connecting Our World: GIS Web Services. Jan Selwood holds a Masters Degree in Geographical Information Systems from the University of Edinburgh. He is an independent GIS consultant based in Japan. He is also the co-author of Connecting Our World: GIS Web Services.
In last week's issue of GIS Monitor, you had a story about using GPS data to convict a killer.
In the wake of the damage inflicted to New Orleans' levee protection system by Hurricane Katrina, the Army Corps of Engineers has contracted John Chance Land Surveys, Inc. (JCLS) to conduct aerial LiDAR surveys for over 400 miles of levees. The FLI-MAP system, developed jointly by JCLS and Fugro, is providing both forward- and downward-looking GPS-referenced video that is being used in the analysis of damage to levees. Also, JCLS is preparing a filtered and cleaned bare earth digital terrain model for use in the design of levee repairs. With the Corps' help in acquiring access to restricted airspace, JCLS conducted the LiDAR survey over a period of six days. The company is currently in the process of processing the LiDAR data, video, and imagery for delivery. CONTRACTS & COLLABORATIONS LiDAR Services International (LSI), based in Calgary, Alberta, Canada, has signed a five year contract extension with Tele Atlas, a geographic content provider, has signed a definitive agreement to acquire Warsaw-based PPWK GeoInvent, a pioneer in mobile mapping systems, for 6.5 million Euros in cash and assumed liabilities. PPWK GeoInvent's mobile mapping system uses a series of still and movie cameras, attached to a mobile van, which captures a detailed, 360-degree digital view of a road — including traffic restrictions, lane counts, and speed limits, as well as actual images of streets, storefronts, road signs, and complex intersections. As a result, portable and in-car navigation system users have a rich combination of content to help them navigate to a destination. Through the acquisition, Tele Atlas also gains approximately 50 employees and offices in Warsaw and Lodz. Garmin Ltd. has acquired MotionBased Technologies, LLC, a privately held developer of Web-based applications for GPS devices. MotionBased Technologies will continue operations as a division of Garmin International, Inc., a subsidiary of Garmin Ltd. MotionBased Technologies, headquartered in Sausalito, California, processes GPS and other data (e.g., heart rate) for performance analysis and online mapping for athletes and outdoor enthusiasts. This Web-based subscription service complements Garmin's fitness and outdoor devices, such as the Forerunner 201 and 301, Edge 205 and 305, Foretrex, and eTrex. Following an outdoor activity using a Garmin GPS unit, customers connect their device to a computer and upload the data to MotionBased, where they personalize and categorize each activity. The application analyzes the data to calculate time, distance, speed, elevation, and heart rate. It then displays this information through charts, illustrations, reports, and a variety of map representations including street, photo, topographic, and elevation maps as well as the Google Earth service to visualize their activity. Users can replay their workout using media controls as they watch themselves move along the mapped route coupled with an elevation profile. Each activity stored in a personal online digest is also added to the TrailNetwork — a growing database of routes created by the MotionBased community. Members use the TrailNetwork to seek out new activities in their region, to find popular routes while traveling, or to engage in "virtual races" with other MotionBased users. ESRI (UK) has won a three-year contract with Royal & SunAlliance (R&SA;) to integrate geographic and spatial information into its core business processes. The contract forms part of a wider transformation program at R&SA.; Benefits are expected across R&SA;'s commercial and personal lines businesses, including the company's direct financial services arm — MORE TH>N. ESRI (UK) will provide R&SA; with spatial integration services using its ArcGIS Server platform and UK gazetteer technology in addition to address level data from Ordnance Survey and Ordnance Survey Northern Ireland. The GIS will be fully integrated with other R&SA; systems and will replace several legacy systems currently in use. Eugene Water & Electric Board (EWEB), the largest customer-owned utility in Oregon, selected ArcFM Viewer for ArcGIS Engine to complement its ArcFM Solution implementation. EWEB provides electricity, water, and steam to more than 83,000 customers in the city of Eugene. This summer, EWEB began implementing ArcFM, a facilities management application, and Responder, a GIS-based outage management system. This project brings together three disparate legacy applications into an enterprise system using the latest technology from ESRI and Miner & Miner. As the project evolved, EWEB recognized the necessity and benefits of having current facility information available in the GIS for both mobile and desktop users who do not require editing capabilities. ArcFM Viewer will provide a mobile viewing option that will supply the necessary functionality for tracing, querying, and analyzing facility data. EWEB's complete enterprise solution is scheduled to be in production by the end of 2005. Intermap Technologies GmbH, a wholly-owned subsidiary of Harman/Becker Automotive Systems GmbH. The agreement combines Harman/Becker's automotive systems knowledge with Intermap's geospatial databases. This teaming arrangement will provide the two companies with the resources to develop 3D car navigation applications and to meet market demand for more intuitive navigation systems and advanced vehicle safety systems. MapMart and Petro Data Source, Inc. have launched a new website that allows customers to acquire well data for the entire United States, along with aerial photography, satellite imagery, digital elevation model data, USGS topographical maps, and more. The website uses a map-centric interface and the data is priced on a transactional basis so that users can acquire it for any specific area of interest. County- and state-level pricing is also available. Data is available for immediate download and can be imported into software applications and shared at no additional cost. PRODUCTS Leica Geosystems has introduced GNSS QC V1.0, a stand-alone software that can perform automatic quality checking and reporting of RINEX data logged by a GPS reference station network. The product is a multipurpose data analysis tool suitable for single stations or networks of stations. It complements Leica GPS Spider or any other reference station software. Advanced analysis tools allow detailed site evaluation, receiver performance testing, and multipath assessment. Last week, Google Inc. launched Google Local, merging the technologies behind Google Local and Google Maps. No longer in beta in the United States and Canada, users can visit local.google.com to find local search and mapping information in one place. Google Local offers users access to such information as integrated local search results and detailed driving directions, and includes features such as draggable maps, satellite imagery, keyboard shortcuts, and more. With mapping data combined with relevant local information from Google's Web index and business listings such as Yellow Page directories, Google Local is a comprehensive local search and mapping product. QUALCOMM Incorporated, a developer of advanced wireless technologies, has announced improved sensitivity, enhanced indoor accuracy, and the seamless simultaneous operation of voice and GPS positioning for location-based services and E911 calls. The enhancements to the company's gpsOne technology are featured on the Mobile Station Modem MSM6125 for CDMA2000 1X networks, providing a cost-effective way to include advanced location-based capabilities on mainstream multimedia handsets and further extending the ubiquity of wireless location services. The same enhancements are also found on the MSM6500 and MSM6550 chipsets for CDMA2000 1xEV-DO networks, to give handset manufacturers several compelling options to address the expanding worldwide demand for location solutions. The enhancements enable uninterrupted and seamless operation of GPS with voice-based location services, such as voice concierge, roadside assistance and E911. The gpsOne solution supports both assisted GPS, to offer increased sensitivity of up to -159 dBm for more precise location information indoors and in dense urban areas, and standalone GPS mode, which extends the service coverage of many location-based service applications to out-of-network areas. QUALCOMM's gpsOne technology is the most widely deployed GPS technology in the world. With more than 100 million gpsOne-enabled handsets at over 40 operators globally, QUALCOMM is enabling dramatically more devices than any other GPS provider. NAVTEQ, a provider of digital maps for vehicle navigation and location-based solutions, now offers full postcodes with its UK database. This feature assists accurate geocoding by linking the UK unit-level postcode with the name, address and geometric accuracy of the NAVTEQ map. The industry sectors likely to benefit from this new information include emergency services, transport and distribution, utilities and telecommunications, retail, and banking and insurance. Spatially linking the unit level postcode to NAVTEQ's UK street maps enables software developers to create a broad range of business-critical solutions that are dependent on accurate geocoding and reverse geocoding. NAVTEQ has finished mapping Northern Ireland and in doing so has become the first company to offer a fully detailed navigable map of the entire United Kingdom and surrounding territories — the Channel Islands and the Isle of Man are included, as well as England, Scotland, Wales, and Northern Ireland. Now available to NAVTEQ direct customers, the Northern Ireland map comprises 15,872 miles of roads enabling navigation systems to give drivers turn by turn directions to and from any address in the Province. The coverage includes every single public road in Northern Ireland and every single mile was driven and verified by teams of NAVTEQ field researchers. Navman, a designer and manufacturer of GPS, communication, and marine products and components, has launched the latest addition to its Jupiter 21 GPS receiver module. The new Jupiter 21 is electrically and mechanically backward-compatible with the Jupiter 12 product family and offers an enhanced combination of low power consumption and cost-effectiveness. Incorporating a SiRFstar IIe/LP chipset, the receiver allows system designers and integrators to apply the technology to a wide array of applications requiring faster acquisition times and enhanced sensitivity. Designed for a wide range of modular OEM GPS design applications such as asset tracking, fleet management, and marine and vehicle navigation, the Jupiter 21 is a single board GPS module solution that also provides an easy migration path from Navman's popular Jupiter 12. The Jupiter 21 receiver is available in two configurations: the standard Jupiter 21 with GSW2 navigation software for most applications and the high-sensitivity Jupiter 21 S with SiRF XTrac software for general navigation in low GPS signal situations, such as dense foliage, multi-level bridges/freeways, and deep urban canyons. Key features of the Jupiter 21 include a form factor made popular by the Jupiter 12 (40.6 millimeters x 71.1 millimeters x 11.5 millimeters); upgradeable Flash memory; state-of-the-art algorithms for optimized urban environment tracking; on-board Low Noise Amplifier (LNA) that supports both active and passive antennas; low power consumption: 75 mA, power management options to further reduce current consumption; user-selectable WAAS/EGNOS compatibility; and RoHS & WEEE compliance (available in 2006). The receiver is currently shipping as pre-production samples, with production quantities available later this month. DeLorme has released Street Atlas USA 2006. This edition includes more than 268,000 additional streets and roads; updated and expanded highway exit services and other places of interest; user-defined keyboard shortcuts; MapShare, which allows users to post maps and routes online; user settings for turn-alert timing when tracking a route with GPS; auto zoom on upcoming turns when tracking with GPS, for greater detail; an address book; and GPS log details and preview. Street Atlas USA 2006 PLUS — available only on DVD-ROM - also includes 31 million business and 116 million residential phone listings. AtlasCT, a developer and provider of mapping solutions, has launched www.ABmaps.com, a mapping portal that provides online mapping services for the North American GIS market. The portal's main features are: easy map navigation; a range of mapping services, including address finding, routings, driving instructions, and POI lookup; support for mapping services over a variety of mobile devices, including cellular phones, Pocket PCs and smart phones; B2B online mapping packages for businesses that want to integrate mapping services on their websites; and additional services, such as weather forecast and real-time traffic information. The engine behind this site is the AtlasNET map server, developed by AtlasCT. It enables real time streaming of mapping data using Macromedia Flash technology and Scalable Vector Graphic (SVG) format. This server technology enables fast interactive map viewing using all Internet browsers and mobile applications. CONFERENCES Three prominent advocates for the development of the open source software industry in Oregon and the nation are now planning to join the first annual Government Open Source Conference on October 13-14 at the University Place Hotel in Portland, Oregon. The event, sponsored by the Open Source Lab at Oregon State University, will explore the potential use and value in federal, state, and local government of this rapidly evolving software concept. With these systems, source codes are open and the software is freely available to anyone for their use, improvement, and adaptation to specific needs. Oregon academic, business, and political leaders believe that the state can become a national leader in the development of this industry. The conference has attracted increasing national interest in recent weeks and the speakers added to its agenda include David Wu, a U.S. Representative from Oregon; Jeffrey Kaplan, founder and director of the Open ePolicy Group based at Harvard University's Berkman Center for Internet and Society; and Tom Rabon, executive vice president of corporate affairs for Red Hat, Inc.. Wu, who will deliver the welcoming address, has been a strong proponent for both this software concept and for Oregon's role in developing it. Rabon, who will deliver the keynote address focusing on the particular value of open source software in the public sector, has more than 25 years of experience in government and the private sector. He leads government affairs and public policy initiatives at Red Hat, one of the leading companies in the world in the distribution of open source software, especially the Linux operating systems. Kaplan, whose group recently released a "road map" for the development of open information technology systems and how they can evolve, will also make a presentation. He cites open source technology as a key to efficiency, innovation, and competition in everything from government to private enterprise and the global economy. PUBLICATIONS The Enterprise for Innovative Geospatial Solutions (EIGS) has released a special publication that highlights how geospatial technology is being used in the aftermath of Hurricane Katrina for rescue, recovery, and rebuilding efforts. Featuring articles, images and other information demonstrating how Mississippi's geospatial cluster is playing a distinct role in recovery and rebuilding efforts, the publication illustrates how EIGS members and partners provided the manpower, expertise, and resources necessary to begin addressing critical problems and providing immediate assistance to emergency responders. Mississippi's geospatial cluster includes universities, private businesses, state government, research organizations, workforce development programs, and economic development agencies. OTHER The Project Safe Neighborhoods Mapping and Analysis Program (PSNMAP) received a 2005 Digital Government Achievement Award (DGAA) from the Center for Digital Government. GeoDecisions developed the application in partnership with the U.S. Attorney's Office, for the Eastern District of Pennsylvania. The national DGAA program recognizes outstanding agency and department websites and applications that enhance information interactions, transactions, and/or services. PSNMAP is a secure, Web-deployed, regional crime analysis and mapping system that collects and archives a wide range of major crime incident data. It was developed to support the federal government's Project Safe Neighborhoods initiative to advance various anti-gun violence strategies. Through the secure site, local, county, state, and federal users can access a network of crime data and perform basic or advanced queries, analyze the results, as well as view crime data through a table or map featuring a geographic distribution of the selected criminal activity. The application was the first federal-level solution integrating local police department data into a federal warehouse, as well as the first multi-jurisdictional application to track regional gun violence and firearm statistics using geospatial technologies. All six New England states and New York will put GIS technology on center stage for GIS Day, November 16, using games, open houses, lectures, and a host of other activities. Held each year on the Wednesday of National Geographic Society's Geography Awareness Week, GIS Day is a global event that celebrates the technology and extends awareness of its important contributions in science, technology, information, and the humanities. Last year's GIS Day included more than 900 registered events in 73 countries around the world. DigitalGlobe has announced details of its next generation of imaging systems, WorldView I and WorldView II, which it has been building concurrently. WorldView I, combined with QuickBird, will enable DigitalGlobe to have the two highest resolution commercial imaging satellites on-orbit for at least a year before any comparable system is launched. By 2008, DigitalGlobe's constellation of high-resolution satellites will enable commercial and government customers to access a broad selection of geospatial information products from a single source. WorldView I, scheduled to launch no later than 2006, will be the most agile satellite ever flown commercially. The high-capacity, panchromatic imaging system features half-meter resolution imagery. With an average revisit time of 1.7 days and a swath width of 16 kilometers, it I will be capable of collecting up to 500,000 square kilometers (200,000 square miles) per day of half-meter imagery. The system will also be capable of directly downlinking imagery to customer locations. The satellite will be equipped with state-of-the-art geo-location accuracy capability and will exhibit great agility with rapid targeting and efficient in-track stereo collection. WorldView II is planned to launch no later than 2008. Operating at an altitude of 770 kilometers, it will enable DigitalGlobe to offer half-meter panchromatic resolution and 1.8-meter multispectral resolution. The system will allow the company to substantially expand its imagery product offerings to both commercial and international customers with a more commercially desirable, higher performance product. Added spectral diversity will provide the ability to perform precise change detection and mapping. WorldView II will incorporate the industry standard four multispectral bands (red, blue, green, and near-infrared) and will also include four new bands (coastal, yellow, red edge, and near-infrared 2). It will be capable of directly downlinking imagery to customer locations and will also have direct tasking capabilities. Six of the finalist teams in the Defense Advanced Research Projects Agency (DARPA) 2005 Grand Challenge for autonomous robotic ground vehicles used the SF-2050 GPS receiver, made by NavCom Technology, a wholly owned subsidiary of Deere & Company. The receiver uses the StarFire Network, which provides decimeter positioning accuracy. The selection of the 23 finalists, who were competing for a cash prize of $2 million, was based on each team's robot's ability to operate autonomously through a treacherous and challenging desert terrain. After receiving the route waypoints just two hours prior to "launch," each robot set out to navigate a 132-mile off-road course accurately, while detecting and avoiding obstacles such as bumpy desert roads, dry lakebeds, freeway underpasses and narrow mountain passes while moving at militarily relevant speed. NavCom's StarFire Network is a global satellite-based augmentation system (SBAS) that provides precise positioning accuracies within a few centimeters of truth. The StarFire Network is used in land, marine, and aeronautical applications in fields ranging from surveying and machine control to offshore and defense.
Matteo Luccio, Editor GIS Monitor Ultimate Map/GIS Directory — Your search is over! GIS Monitor is published by: GITC America, Inc.
|

|
part, without prior authorization from GITC America, Inc. GIS Monitor is a GITC publication. |