Letters, Points of Interest, Kudos and Conundrums, Week in Review (Announcements, Contracts, Products, Events, Training, People) Back Issues, Advertise, Contact, Subscribe/Unsubscribe If, for some reason you cannot read this document, visit: http://www.gismonitor.com/news/newsletter/archive/010605.php
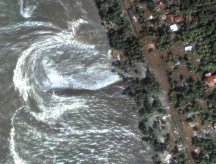
Tsunami Response and Geotech Oak Ridge Map in Demand. Oak Ridge National Laboratory's LandScan Population Database is in use in the recovery efforts. The map was first created for the Department of Defense in 1998 and has been updated each year. The map includes (free registration required) census numbers, satellite imagery, and geographic data and estimates who lives and works where, data that's hard to glean from remote areas such as the affected islands. (LandScan is available via Geospatial One-Stop, see below.) Maps of Disaster. NationMaster.com hosts statistics and maps relating to the unfolding catastrophe in South and South-East Asia. These data are updated periodically as figures change, according to the website. (The website is from New Age Media Concepts, an advertising/news/PR company.) Whose Satellites? The AP reported that "A U.S. defense agency is using its spy satellites to measure the scope of the devastating tsunami in Asia and help workers manage their relief efforts." The agency in question? The National Geospatial-Intelligence Agency, NGA. So far as I know, that agency has no spy satellites. The actual NGA release makes it clear that the agency is using its commercial contracts to provide images to U.S. agencies involved in rescue, recovery, and relief efforts. Satellite Imagery of Southeast Asia. Both Space Imaging and DigitalGlobe are preparing imagery of the areas stricken by the earthquake/tsunami. IKONOS passed the area on Tuesday after the event, while QuickBird passed by "when" the event occurred. The Denver Post noted that other imagery was being prepared for sale. DigitalGlobe offers a gallery of images, along with analysis, which provides some of the most dramatic images, and interpretation, from a spatial perspective, that I've seen. Space Imaging offers "side by side" images in its gallery. ORBIMAGE put out a press release Monday noting that since December 27th it had been dedicating all of its available satellite imagery collection time over South Asia for the collection of high-resolution imagery of areas affected by the tsunamis. A gallery is here. Over at the National Geospatial-Intelligence Agency, Dave Burpee, chief of public affairs, commented that the agency is using its existing commercial contracts to access and distribute imagery: "We take requests from lead federal agencies, such as the State Department, the Pacific Command, or other federal agencies that need information. They provide the information to whomever they deem appropriate…We're buying with an unrestricted license; we can give them to anybody." NPR interviewed GlobalSecurity.org's John Pike about the role of imagery and its use as an argument for a warning system. Pike explains the value of "before and after" pictures this way: "If a single image is worth a thousand words, two images are worth ten thousand words." MSNBC put together a nice "before and after" slide show from DigitalGlobe imagery. Unfortunately, the company name is misstated as "Digital Globe" in the accompanying article. NGA is referred to as the "National Geo-spatial intelligence Agency." And, if you didn't know, the article claims, "With a commercial satellite's resolution, the smallest item that can be distinguished is around two to three feet while a military spy satellite can 'see' things between three to five inches, which can be critical when viewing objects like airfield runway debris." GOS Updated for Relief. ESRI, its distributors, and partners have begun posting content about the Indian Ocean Disaster to Geospatial One-Stop. A new sub channel (which currently has nine datasets) went live on New Year's Eve. More resources were expected to be added. At least one dataset has the note, "NEED PASSWORD," as it's not public data, but rather part of ESRI's ArcWeb Services, a pay to use service. The LandScan worldwide population data set from Oak Ridge National Lab is also available through the channel. The announcement of the channel came from ESRI. And, oddly, I've seen no requests to add data to the channel. Non-Profits in Action. I've already received a request from a reader about volunteering his GIS expertise to help in the relief efforts. I'm not yet aware of agencies looking for such offers, but will pass them on, should I receive any. In the meantime, read this account from MapAction, a non-profit that specializes in mapping during disasters. It reminds me, eerily, of the descriptions I heard of mapping at Ground Zero after 9/11. Kudos to Vodafone, which has donated £100,000 to MapAction (and Telecoms Sans Frontiers) via its charitable trust, the Vodafone Group Foundation, to support efforts in southeast Asia. Landsat Imagery. Lest we think that only commercial imagery can serve scientific and rescue efforts, Landsat 7 is contributing useful imagery. A scientist at Columbia used before and after imagery to look at the loss of vegetation. The article in New Scientist includes an image that appears to include banding from the SLC off sensor. The stripes are used as scale reference: each is 180 km wide. The article also reports that The Indian Ocean Tsunami Geospatial Information Service was launched on Sunday (detailed instructions for ESRI software users, here [pdf]) to collect imagery of the area. The map service has since been added to GOS. Mapping Portal. DM Solutions launched a mapping portal addressing the Tsunami Disaster in the Indian Ocean Region. A note on the website specifically requests input from the community: "We encourage Data Providers to help us respond to Data User requirements by providing no-cost, high quality (geo-referenced) data that can be quickly and effectively integrated within this Website and used to generate meaningful and helpful maps."

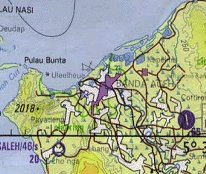
NGA Map Sale Change NGA states that international deals for data sharing require this change since these products compete with in-country efforts (public and private) to develop and sell such maps. In addition, there is mention of increased security, since after October sales will be limited to Department of Defense players. The sales policy change has prompted one person to set up NGAMaps.com, a website to trade CDs of the data in question (almost none has copyright). The goal is to purchase as many of the $14 CDs as possible, so that all of the data is available in the civilian community before it's no longer available. There are no sales at the website, nor is it a profit making scheme, says its creator. The data are in ARC Digitized Raster Graphic (ADRG) and can be read by ESRI's ArcReader with the ARC extension and other software including NIMAMUSE (which can also convert the data to JPG or TIFF).

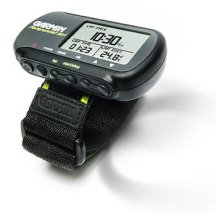
I have to give the folks at Garmin credit for providing an interface that's very easy to use. To be honest, the detailed steps in the manual seem far more complex than the actual "programming," once you get the hang of it. And, since I have a Garmin E-trex (that I use for geocaching) the procedures were all the more familiar. It took me a few runs to get the hang of leaving the Forerunner outside to find satellites before I left. I also had to experiment with the best way to fasten it on my arm (there's a Velcro band) while wearing gloves. I spent probably a half hour indoors walking through each menu and looking at the options to determine what features I wanted on or off. So far I've used the unit with the "beep at each mile" turned on and "stop the clock when I stop and turn it on when I go" turned on. I have yet to play with the interval training (stopping and starting) or the virtual partner (an imaginary friend who runs with you, letting you know if you are dropping behind or running ahead of a preprogrammed workout). Uploading Data What I really wanted to write about was the experience of capturing data to the device and then trying to map it. Garmin provides its own Logbook software for the unit that runs on a PC. You download the data from the Forerunner (via a serial connection) and then can look at each week's runs. For each run (and each lap) there's data on distance, pace, even a simple "route map" (just a line, with no data behind it), and an altitude change chart. Uploading the data was a snap. After checking out what the provided software could do, I sought the next step: creating a real map of where I'd been. Making Maps: The Geeky Way Luckily a kind soul has a website with links to software that works with the Forerunner. It lists the provided Logbook software with a note that indicates it "needs work" to be really useful. One of the challenges of the Forerunner is that it outputs data only in XML. XML, extensible markup language, is great if you are programmer, but useless if you are not. Another challenge of XML data dump? The only option in the Logbook software is to dump out all the data in the Forerunner, not just one route or run of interest. That is, the export function dumps all the runs you have stored, ever, which can total two years worth, if I recall correctly. But, there is good news in the top two listed programs on this webpage. Both are free. G7ToWin takes the mysterious XML from the Forerunner and puts it in a form mapping software can use, like gpx and trk, formats other GPS units write. GPSBabel is a second offering in that space, which is open source. (I'm not sure about the G7ToWin.) Reading the list of input and output formats, I could only think that these products (and others, I'm sure) are the "Safe Software" of the GPS set. But, for me, who wanted to make a map, a third program on the list was paydirt: GPS Visualizer by Adam Schneider. Basically, you upload your GPS tracking file (it can be from a wide variety of GPS devices in a variety of formats) and voila, you get a map! It's a bit more complex for the ForeRunner because first you have to get just the run you wanted exported to XML, instead of every run in your unit. There are few ways to do that. One is to delete all the runs you don't want in the Logbook software, then do an export of just the remaining data of the run you want. Another, is to export all the Logbook data (many runs) to XML and use the neat tool on the GPS Visualizer website (also available as a PERL script - geeks only need apply) to parse it into individual runs. Now you are cooking! Upload the single run XML file to the GPS Visualizer website (and tweak the many options for how the map should look) and you get a map.
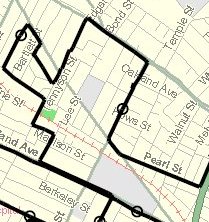
Well, you get one if you have an SVG (scalable vector graphics, an ISO standard, not yet supported in most Web browsers) plug-in installed since that's the format used. I didn't have it installed since there's not much call for it in GIS…yet. I downloaded it, free, from Adobe, which was painless. Once I got the hang of the complex, but powerful options page, I was adding a title, creating a thematic map of the route (based on speed, distance and other attributes), and selecting different background data (USGS quads, TerraServer images, Landsat). Each time you change an option the SVG file is recreated for you. If you find a map you like and want to keep, you can then save the SVG locally and/or capture a JPG of it for sharing. One note on the JPG files: because some of the data is copywritten (by GDT) creating a JPG may include only the SVG route (above, left). Using public data, say TIGER, or some clever data capture, you see the background, too (below, right).
Now, I'm pretty technical, and searching the Web for these tools and parsing XML and downloading an SVG plug-in was no big deal. But, I suspect it might be hard for someone who's less comfortable with technology. I did a totally unscientific poll of my running club's e-mail list members, who have GPSs and asked how many of them ever mapped their routes. The breakdown: - 1 uses DeLorme Topo USA Making Maps: The Non-Geeky Way Motionbased.com, a website mentioned in GIS Monitor a few months ago, was touted by one runner. He noted it was still in beta and still free, so I gave it a shot. (The company seems to be in the situation of deciding what will be free and what will require payment, so this is a good time to check it out.) Like GPS Visualizer, the website works with a number of GPS receivers. One difference: MotionBased.com encourages visitors to use its software (Windows only) to extract the GPS data directly from the device to the website. I don't like using excess software if I can avoid it, so I looked for the option to upload the XML data dumped from the Forerunner. You can indeed do upload Forerunner XML data and a few other formats, including G7ToWin, without downloading any MotionBased.com software. You do, however, have to register for a free account. I uploaded my entire XML dump (all my runs) and was pleased to find the upload process parsed them into eight separate activities. I could name each one, assign it an activity type (running, cycling, etc.) and a subtype (road, trail) event type (race, tour, training), and provide comments. Then, I could select which of the eight I wanted to submit for the full MotionBased treatment. I selected two: a bike ride and a run, each about 10 miles. For each one I could look at the activity via one of three tabs. The Dashboard tab provided an overview of data about the activity: an overview map (SVG again), time, distance, speed, elevation, weather, and equipment. The weather data is the only data not from the GPS; it comes from local historical weather data. Another new piece of information for me: a measure of the GPS signal quality.
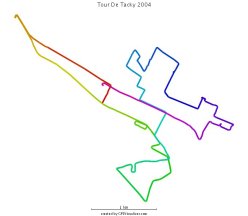
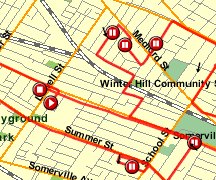
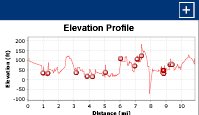
Moving to the Analyzer tab, I got a decent map (overlain on street data, by default, copyright ESRI and GDT for those keeping track), a breakdown of each mile (laps, as calculated by my device), and a color coded elevation profile. Clicking on a lap on any of the three windows highlighted the corresponding information in the other two. I could change the background data to photo (aerial imagery, copyright GlobeXplorer/i-cubed though the text is hardly readable; the docs say its USGS DOQQs, though the imagery appeared not much better than the TerraServer data from GPS Visualizer), topo (DRGs from National Geographic TOPO! says the documentation), elevation (rough DEMs, NED says the documentation, with reference data from ESRI), or blank (none). The coolest tab was the third one: Map Player. Yes, that's right; this tab plays a little movie of your path, complete, in the case of the bike ride, with stops (above, left). (The ride in question was the local "Tour De Tacky" an evening tour of our local holiday lights, so we did stop periodically.) As the little red dot traverses the route, information on time, distance, speed, and grade displays. And, at the same time, another red dot traverses the elevation profile (below, right).
Like any other good mapping website, MotionBased allows you to send a "post card" to friends to show off your activity. They receive JPG preview of the map and if you have made the activity public, they can visit the activity and see the Dashboard and Map Player tabs for themselves. I'm not sure why Analyzer is not available. (I suspect that'd be the one a coach would want to see.) There are two other options worth mentioning. The first is "dot racing." If you run or cycle the same route over and over you can "race yourself" by "playing" both versions on the Map Player. This is called "dot racing." And, of course, if someone else covers the course, they can "dot race" with you, too. I think it'd be interesting to see your teammates race you after the fact, for example. The second option worthy of note is TrailNetwork, is a set of shared activities that everyone can see. The idea is to share routes and experiences with others. I found a bike ride in Redlands, California, for example. (You'll need to register to see it.) Conclusion So, bottom line? I like both sites, especially since they are free! Do note that while GPS Visualizer includes data worldwide, MotionBased for now focuses on the United States. GPS Visualizer is for the geeks who like all the mapping options, and want to play with SVG files. It might be a bit much for the technically naïve. MotionBased is a better choice for those less comfortable with technology, with its slick interface, very active support forum, and "neat" toys such as animated playback, dot racing, and e-mailing of activities. Special Note to Garmin: Consider negotiating a free month of MotionBased for those who purchase your products. I wrote that sentence last week. Yesterday, a press release on the new Forerunner states: "Garmin has also formed a partnership with MotionBased.com to provide Forerunner 301 users with unique Internet-based performance analysis and mapping tools for GPS and heart-rate information."

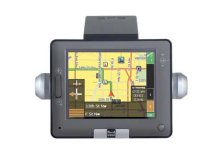
Dual Electronics is gearing up to ship two versions of its NavAtlas vehicle navigation product. The company claims they will be the first mobile GPS navigation system to incorporate an internal hard-drive system instead of CD and DVD based software and data. Scheduled to ship in February, the $1,200 mobile navigation system includes a 20GB hard-drive preloaded with Tele Atlas digital maps for the entire continental U.S. and Canada, and 2,000,000 points of interest. Cobra, the folks who are known for family radios, are delving into navigation systems. Features in the NAV ONE include: easy install, moveable between cars, detailed street maps for the entire USA and major Canadian cities, self contained, 2 million points-of-interest in all, voice directions, built-in gyroscope keeps track of your movements during times when satellite signals are temporarily lost; beam addresses from your PDA into the GPS. Garmin announced the Forerunner 301 (see above) at CES. There's been quite a buzz in anticipation on a newsgroup I frequent. The big news? The addition of a heart rate monitor and some new software - and a $300 price point. The iQue M5 is due out later this month at $750. It runs Windows Mobile (instead of PalmOS) and includes a GPS chip and map data. One writer loves the new StreetPilot c320/330 which is dead simple and includes 3D (or old fashioned 2D) maps. Thumb drives are getting bigger - at least in storage space: Lexar's JumpDrive Lightning offers 1GB for $135 or 2GB for $275. NVIDIA, the graphic card maker, will show, for the first time "a new approach to in-car 3D info-tainment." Partners UCLA and Pelican Mapping helped build an "integrated, innovative device which will allow the user to map, track, communicate and entertain." A 3D view is "more like" what one sees out the window than the traditional "ortho" view. DesignTech offer two phones to overcome the "tyranny of distance." The Guardian 911 has one button and when used with a base station connected to a landline up to 800 feet away, can call 911. The 2 Mile Phone extends a landline, wirelessly, up to two miles. TiVoToGo is a new service feature that lets users transfer their recorded television shows onto laptops, and soon also to blank DVDs and other portable media players. Trimble introduced a new version of its TrimTrac locator, a GPS device that sends location information via cell phone networks. Redesigned in a water-resistant housing, the new TrimTrac locator has an expanded feature set that includes on-demand polling, motion-based or scheduled reporting, and other enhanced query functions.
Stellus System, Inc announced the SSI-SDIO-1000, the first high-performance, rugged GPS receiver with a SDIO (Secure Digital Input/Output) interface designed for power conscious consumer-level applications. It's quite small. Wherify Wireless, Inc was honored by the Consumer Electronics Association with two 2005 CES Innovations Awards for its Wherifone G550 GPS Locator Phone. Wherify was recognized with an award for excellence and innovation in both Wireless Communications, and in Mobile/Vehicle Electronics Navigation, Safety, and Security. The low-cost, limited functionality, trackable phone is marketed as a "First Phone" for pre-teens or as a "Companion Phone" for seniors or special needs family members.
Letters "After reading the letter from Anthony Quartararo in the December 16th issue, I find myself amazed that many in the geospatial community still don't understand why governments create spatial data and why the ruling in Florida is both correct and fair. I wholeheartedly agree with the appeals court judges and with interpretations of public records laws that prohibit cost recovery and/or copyrighting data or maps by public agencies. "Whether federal, state, or local, governments don't develop spatial and tabular data specifically for public consumption, they build it to help them perform their mandated functions in the most efficient manner possible. Unfortunately, this internal cost savings due to greater efficiency rarely, if ever, gets factored into the mix because it is a soft cost savings that is not easily quantified. Also, anybody who thinks that a government entity can ever charge enough to truly recover costs has obviously never taken a critical, objective look at what it really costs to develop the data. "At the Snohomish County Assessor's office, we make our data available to public. If you can download it, it's free. Much of it can be accessed on the Internet. We ask the public and private sector to use it--PLEASE. Why? It's free because we develop only about half of the data we consume. The other half comes from outside the confines of our government walls. The chances of me being able to double my staff in order to build and maintain (in perpetuity) the other data I need is, well, nonexistent. I will also probably never be able to budget enough to pay anyone else's cost recovery should they charge my office. Making a stable, highly accurate cadastral base easily available for others to build their data on top of has, with rare exception, created an atmosphere in the county where data does get freely shared (even by private sector consultants and surveyors). And, because we're using the same cadastral base, the data is pretty much plug and play for everyone. "A large percentage of government agencies do charge something for their data. There are endless examples of creative accounting methods to roll this cost or that into fees charged for data. It has been my experience, though, that the governments reaping the greatest benefit are the ones charging the least or nothing. "(P.S. … and those businesses making a profit from public data, in Snohomish County, Washington where we have a property tax, they pay about 26% of it. I suspect the situation is pretty similar across the country in other states with property taxes. So, I would disagree that businesses don't represent the public at large.)" • David W. Allen, GISP of the City of Euless, Texas who contributed his experiences working on mapping the Shuttle disaster in 2003, highlights two new documents that might be of interest to readers. "The local papers in East Texas that were in the center of the Columbia disaster have published a book on the topic. It contains many photos and reprints of the stories published during the recovery effort. It's of great interest to anyone who worked on one of the recovery teams, or who had an interest in how GPS was used to map the pieces. "The website is [here.] Not much is shown about the book, just how to order it. "Also of interest is the government's final report on the shuttle disaster. It has some great maps showing all the GPS data collected in the field and how it was used to determine which parts of the shuttle came off first. The report can be downloaded chapter by chapter (6 chapters) from this website, or the printed report can be ordered." • Reader Dan shared another publication of note for geography enthusiasts. "I can't pass up the opportunity to point out that this week's issue of Sports Illustrated is focusing on a 'Sports Atlas.' If you never pick up another copy of SI, this is the one to get for geography enthusiasts. There are easily a couple dozen pages devoted to national displays of a variety of sports-related demographics. And they explore several different types of mapping styles. Nothing in recent memory comes close to linking such popular past-times with their spatial components. I think this is the perfect example of how we can approach a large audience and present information that highly relates to a reader's interests while providing a wonderfully educational aspect as well." • Nick Park at GeoFields shared an interesting note on the preferred name of the Arabian/Persian Gulf. National Geographic has updated its atlas to Persian Gulf (see below). "Referring to the Iranian campaign against the name 'Arabian Gulf,' they went as far as Google-bombing the phrase. Do an 'I'm feeling lucky' search for 'Arabian Gulf.'"• Another reader explained that "'Persian' was the original (pre-European) and 'Arabian' the latter (post-colonial)." Along with holiday wishes, I received some interesting responses to the year end issue: • "Good issue: the top 10 is great; includes lots of stuff that I don't have the bandwidth to know about, so your list piques my interest! " • "I would like to highlight GEOdiffusion as one of the events of the year for me. I reckon I attended approximately 25 events worldwide and the caliber of attendees and speakers was fantastic - Mark Cattini, Alain De Taeye, Hydro Quebec, Ministry of Natural Resources, Ministry of Transport, Telus, etc. … [The event is] organized by Korem, but I felt compelled to highlight it to you." The editor notes: Look for coverage at Directions Magazine in the coming weeks. • "I'm Alex from Bogota, Colombia and I only want to say you thank because for me the news about new technology is very important. Thanks again."
.jpg)
Points of Interest ESRI and NGA. In a "just before Christmas" announcement, ESRI confirmed a deal with the National Geospatial-Intelligence Agency (NGA) for an Enterprise Software Agreement (ESA). The NGA ESA provides unlimited licenses and maintenance for the majority of ESRI products, such as ArcGIS (ArcInfo, ArcEditor, and ArcView), server products, application and extension products, and development software. During the term of the ESA, NGA has the right to deploy an unlimited number of licenses for all core ESRI products. Location, Location. Ever wonder why Intergraph's lawsuits are always filed and tried in Tyler, Texas? It turns out a judge there likes patent cases, the large retired population is a good jury pool for long involved cases, cases are scheduled and tried quickly and efficiently, and the costs are far lower than in New York or Chicago. Unfortunately, as word spread about the "rocket docket" it drew more cases and is, well, slowing down. That despite two additional judges joining the patent case parade. End of the Year Stock Picks. While Autodesk got all sorts of praise for its performance this year (up 213%) a writer for Bloomberg picked "speculative" Intergraph for 2005. Despite a few lawsuit wins recently, John Dorfman finds the stock, at about $27 "intriguing." He's quick to note that revenues fell to $135 million in the September quarter from $301 million in the fourth quarter of 1997. Persian Gulf. National Geographic, under pressure from the government of Iran and others has provided an update to its printed atlas that restates the name of the Arabian Gulf to the Persian Gulf. The update also removes claims by the United Arab Emirates on several islands in the area. "National Geographic's climbdown and correction of this fake name it had used for the Persian Gulf ... is a victory for every Iranian," said Kamal Kharrazi, Iran's foreign minister. Microsoft Researches Routing. Reader Martin shared this link to a review from June of an open house at Microsoft Research. It seems the company is working on a new routing algorithm, one that might be used to reroute travelers based on real-time traffic data. While there is no promise the technology will make it into a product, it's clear that many geospatial things are under exploration at Microsoft. Recall that the new Microsoft Research lab in India also has geospatial topics on its plate. Update Your Magnetic Declination. The National Oceanic and Atmospheric Association (NOAA) released a new Magnetic Declination file on December 16. The folks at DeLorme sent an e-mail to its users to be sure to download the updated file. Happy New Year! No Tracking Allowed! In California a new law protects you from being tracked via GPS should you rent a car. The law prohibits tracking for the sake of fining you for speeding or going outside the agreed area, but it can be used to track down stolen cars. The legislation came about in part due to "horror stories" of lawsuits from those fined. Some expect this law to have legs and appear in other states and/or to see its impact in contracts across the nation for larger car rental companies. Map2Phone. MapQuest launched Send to Phone, a new feature that lets MapQuest Mobile subscribers send color maps and driving directions from the MapQuest.com website directly to their cell phones. MapQuest Mobile subscriptions are $3.99/ month. The service requires that the map be requested from a computer and then sent to the phone number in question. Tommy McGloin, general manager of MapQuest, said a version planned for June will add even more features, including location awareness when using GPS-enabled phones. That way, users will have to enter only the destination for driving directions.
Kudos and Conundrums Kudos (concepts we applaud) Students Map Crime. In contrast to a big crime mapping GIS program in the City of Camden, NJ that shut down since no one could run it (see below), students are doing crime mapping in rural Pennsylvania. Students at California University of Pennsylvania geocode crime information for several local towns, providing maps to officers who might never have access. Thematic Mapping of the Highway. The Boston Globe reports that in the south shore city of Quincy it can be hard to tell where you are on the highway when reporting an accident. The not so large city is a maze of exits, on ramps and splits. (I avoid the whole thing and take the long subway ride down there when required.) The city council voted unanimously for a proposal to color code the complex highway system using perhaps eight different colors on Jersey barriers, light posts, and guard rails. So far as the folks in Quincy know, this is the first such proposal of its kind. The Massachusetts Highway Department thinks the colors would be a distraction and has the final say. Conundrums (concepts we question/give us pause) Cops Don't Map Crime. In a pretty amazing feat, the City of Camden, NJ, one of the cities with the highest crime rates in the country, scrapped its GIS-based crime analysis system "because police said it was inadequate and no one in the department knew how to get it to work." That was in April of last year. It seems the one fellow who did know how to use it was moved to another department. The system, built by MapInfo was purchased with a $175,000 federal grant. Recently, the Police Department spent $101,000 on a new mapping system from GeoDecisions. The contract was no-bid as the state has a contract with the company. The current police administration explained that it couldn't get into the MapInfo system and it didn't integrate with other city systems. MapInfo says the city never contacted the company for help after the officer was reassigned and confirmed the original system was Web-based. In another odd turn, the reassigned officer was not given permission to speak to the press.
Week in Review
Please note: Material used herein is often supplied by external sources and used as is.
Trimble announced that it has entered into a definitive agreement to acquire privately held Pacific Crest Corporation of Santa Clara, Calif., in a cash transaction. Pacific Crest is a supplier of wireless data communication systems for positioning and environmental monitoring applications. Space Imaging is asking the public to help pick the 10 most spectacular images of 2004 from a preselected list of 23 chosen by the company. Visitors to the survey page are asked to select the 10 "most spectacular" images. The North Dakota Game and Fish Department honored Brian Hosek, geographic information systems specialist in Bismarck, with an Innovations Award, for his efforts to implement GIS technology to improve department goals and objectives. In-Q-Tel, Safe Software and Visual Learning Systems joined the United States Geospatial Intelligence Foundation, USGIF, as sustaining members. The Foundation now has more than 50 sustaining members. • Contracts and Sales Xybernaut Corporation announced an add-on contract valued at approximately $100,000 from a Virginia county for continued use of a Xybernaut service-based software solution developed to help the park and recreation department manage athletic facility use scheduling and maintenance. La Petite Academy purchased geoVue's mapping and demographic analysis software -- iSITE. La Petite Academy, Inc. is among the nation's largest privately-held early childhood education companies in the country. PCI Geomatics announced the integration of GeoTango's SmartDigitizer technology for semi-automated feature extraction. This revolutionary technology quickly extracts feature lines and polygons from a wide variety of remotely sensed images. Smart Digitizer will be available in the 2005 release of Geomatica, PCI Geomatics' flagship geospatial image processing software. PlanGraphics, Inc. has been awarded a contract to design and develop an Internet application to allow the public to search and view soil data maintained by the New Jersey Department of Transportation (NJDOT). The contract is a collaborative effort between PlanGraphics, Applied GIS, Inc., and Civil Solutions. DigtialGlobe QuickBird satellite imagery was recently used by the Arkansas Geographic Information Office (AGIO) in order to prepare for the Clinton Presidential Library opening. ManTech was awarded a contract from the Space and Naval Warfare Systems Center, San Diego, valued at $76 million, to provide training for Command, Control, Communications, Computers, Intelligence, Surveillance, Reconnaissance (C4ISR), and other Department of Defense related systems. The competitively awarded contract has a five-year base period, with eight, six-month options, giving the program a total potential value of $76 million. Intergraph Mapping and Geospatial Solutions announced Telefonica de Espana S.A.U. has chosen Intergraph's G/Comms, the company's next-generation technology for communications utility geofacilities management based on G/Technology, as the enabling core for its Geospatial Resource Management System. IONIC has been chosen to build an intranet/Internet portal for the Luxembourg National Department of Cadastral Information. The portal will incorporate the latest OGC standards, including a transactional Web Feature Service and will allow users to consult and download a variety of disparate sources of geographic data in one common environment. Leica Geosystems GIS & Mapping announced the sale of a Leica ADS40 Airborne Digital Sensor to Woolpert. • Products AlphaPixel, LLC has released version 1.16 of their debut product, PixelSense. PixelSense is a quick and easy tool for processing remote-sensed imagery such as Landsat TM and ETM bands into realistic natural-color georeferenced GeoTIFF images, ready-to-use in any mainstream GIS or visualization software. SIA's dataMAP GIS now supports MapRite, the Positional Accuracy Improvement solution from TENET. • Events • Training • People
GIS Monitor Back Issues
Advertise With Us
Contact GIS Monitor is published by: GITC America, Inc.
Subscribe/Unsubscribe |