| |||
|
Adena Schutzberg June 30, 2003 Last week I provided a brief review of the ESRI hosted portal at www.geodata.gov. Soon after GIS Monitor was published that website posted an "under construction" notice. However, http://gosstg.esri.com/ continued to run with what looked like the latest version of the portal. To be clear on how I got to these websites: I found the www.geodata.gov address on the GOS website and the alternative URL at a Forest Service website. Also listed there was the OGC version of the website, http://gospi.saic.com/gospi/portal/portal.html. The application at that URL didn't work - lots of errors, but if you go to the root, the application seems to run fine. In any case the "final" version of the portal, the ESRI version, is officially up and running on June 30, 2003 at geodata.gov. To be complete I wanted to examine the OGC created portal, too. First off, the website carries this statement, "THIS IS NOT THE OFFICIAL GEOSPATIAL ONE-STOP PORTAL. This is the Open GIS Consortium's reference implementation that was developed to demonstrate the power of interoperability. It is based on open specifications and is a vendor-neutral gateway to standardized Web Map Servers and Web Feature Servers. In turn, other software applications can access this portal using published specifications." It's fair to say the OGC version has a different organization. Instead of listing all of the data types available on the main page, it divides tasks into three categories: getting started, publishers and developers. The first highlights how to make maps and get data, the second addresses how to publish data to the portal, and the third details how developers can take advantage of the standards used. I think this makes it clear where each type of user can concentrate energy.
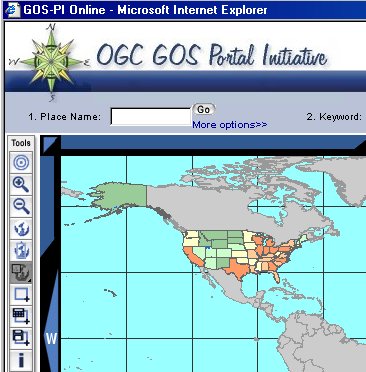
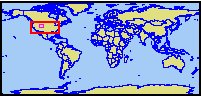
Instead of having the search and viewing tools separate, the OGC implementation hosts them all in its map viewer. While the ESRI version presents, by default, The National Map (a U.S. map), the OGC version presents the entire world with the U.S. highlighted. As you zoom in or select different layers you can watch each one "paint over" the previous one, which highlights that data is coming in from several different sources. As you mouse around the map, Lat/Lon is presented in the lower left. Also on screen at every turn, is an overview map, like the one below.
For non-spatial searches there are input boxes for place names, key words and map categories. Unlike the ESRI offering, there is no option for searching on the date of the data. I keyed in a place name, State College, and was presented the two locations found, one in Pennsylvania, the other in Georgia. I was advised to pick one and click the "zoom to" button. I appreciated the ability to set a buffer of how far around the area I wanted to see.
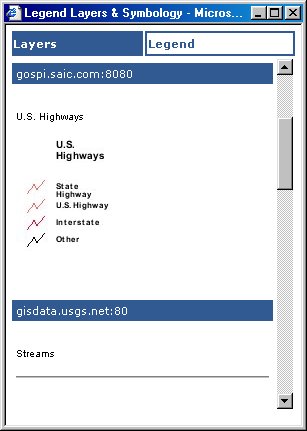
The map returned was fine, but I was curious about one set of shading on the map. I chose the Layer/Legend button and saw a list of layers used to build my map, with check boxes noting which were on. The button to "update the map" is called "draw layers" which seemed odd since sometimes what I wanted, really, was to "undraw" layers. There was however no real "legend." I thought the "edit legend" button might help in my quest to find out the what the mysterious gray mesh illustrated, but instead I found a tool to move layers up or down on the list. Almost by chance I noted a second "tab" on the dialog box titled "legend." That in fact provided a very pretty legend. Unfortunately, it was seemingly provided piece by piece from each of the servers providing map data, and required quite a bit of scrolling to explore. It also appears that only some of the servers could provide legend information. One annoyance: while working with the map viewer, it seems any click, left or right, activated the currently active button. That meant that a few times I re-centered the map when it fact I was trying to use a right click to pull up a window "refresh" from the Windows right-click menu. The OGC portal has many, many tools. I counted 12 that had icons, plus another tool, a "scale" to change the zoom level. I tried to "identify" something with the "i" tool. I learned that the "System does not support the specified encoding." The error reported included: "http://gisdata.usgs.net/servlet/com.esri.wms.Esrimap?�" A few other tries were unsuccessful, reporting "no feature found." Each identify requires selecting which layer of data from which you want to identify features. I did finally successfully identify some data on soil moisture. Another tool allows the user to draw the "area of interest" (AOI). A second calculates its area and centroid. That's a nice tool, but I wonder how widely used it might be. A third tool places the overview map in one of the four corners of the main map window. I could not find a way to turn off the overview map, though most of the time I was just as happy to have it visible. The OGC portal has potential. It has an "advanced" sort of feel, one GIS geeks, (into which category I'll put myself) might love, but one that casual users might find a bit overwhelming. I don't know the cause of the failed "identifies," but certainly those would be frustrating to a casual user. On the other hand, my guess is that this portal implements more OGC draft and approved specifications and in-development documents than any other single piece of software on the planet. (I say that as someone who consults to OGC.) The website lists 12 of them. This approach makes sense considering the goal of the effort, "a reference implementation that was developed to demonstrate the power of interoperability." | |||