Departments:
News Briefs, Back Issues, Advertise, Contact, Subscribe/Unsubscribe
If, for some reason you cannot read this document, visit: http://www.gismonitor.com/news/newsletter/archive/020324.php

Editor's Introduction
.
In this week's GIS Monitor, I tell you the buzz about last week's 2005 GeoTec Event conference in Vancouver, Canada, and give you a heads up on two other conferences that are coming up in early March; describe how the University of Oregon's InfoGraphics Lab integrates GIS and cartography to help manage campus operations, assist faculty in their research, report on the work of state agencies, and teach students the latest geospatial technologies; share the responses from two readers' to the questions I posed last week; and do a round-up of GIS and related news.

Conferences
.
This year's conference season is in full swing! Last week, from February 13 to 16, the 2005 GeoTec Event took place in Vancouver, Canada; GITA's Annual Conference 28 will take place in Denver from March 6 to 9 and the ASPRS 2005 Annual Conference will take place in Baltimore from March 7-11. I spoke to several GeoTec participants and report here on their comments. I will not be able to attend GITA, but I am sure that I will hear all about it from many of you (hint, hint!) and will report on that conference in the March 10 issue. I will be at ASPRS, so I will be able to report on that event in person and meet many of you there.
The annual GeoTec Event is the largest geospatial technology trade show in Canada. Matt Ball told me that 1,200 people registered for the conference and 35 companies were present in a total of 64 booths during a compressed, two-day exhibit. Ball, the editor of GeoWorld magazine and the conference's Show Manager, acknowledged what several other participants also told me, namely that attendance was down from last year; he attributed this to the current strength of the Canadian dollar.
The opening keynote presenter was Mark Monmonier, a professor in the Department of Geography at Syracuse University, and the author of, among other works, How to Lie with Maps and Spying with Maps: Surveillance Technologies and the Future of Privacy. His talk explored the ability to manipulate public will through the power of geospatial technology. The basic point that Monmonier tried to make was that geographic information has a range of societal implications and can have significant unintended consequences. He is very much in favor of "public participation GIS", which he says is getting a lot of interest in and out of academia, and he is critical of academic writings that present GIS as inherently value-laden. "However," he told me, "if people who use GIS do not consider carefully the possiblity of public resistance, it can backfire."
The most popular topic at the conference was the role of GIS in the Olympics. John Furlong, Chief Executive Officer of the Vancouver Organizing Committee for the 2010 Olympic and Paralympic Winter Games, delivered another keynote address. Furlong's presentation was accompanied by several others with Olympic organizing experience, who discussed the large role of GIS in logistics, environmental planning, and security for an event of this magnitude. Dave Busser, ESRI's Director of Corporate and Business Development and Chief Information Officer for the 2002 Olympics in Salt Lake City, discussed the role of GIS in planning for the games. He told conference participants it has increased greatly since 2002, when it was used mainly for vehicle tracking and routing.
Paolo Orione, head of transportation for the 20th Olympic Winter Games — which will take place in Turin, Italy, next year — discussed the role of GIS for tranportation and logistics. Specifically, he said that GIS helps managers deploy volunteers by determining their proximity to various facilities. According to Ball, one very interesting aspect of Orione's presentation was his admission that he has a GIS technician work 10 hours a day just printing customized maps, to satisfy the great great hunger for maps from organizations that are not yet able to generate them digitally.
Sam Bacharach, OGC's Executive Director of Outreach and Community Adoption, commented that 2005 GeoTec "was up to its usually fine mix of knowledge dissemination and thought provocation. The stimulation was welcome as two U.S. academics, one Canadian academic / industry proponent, and a Canadian consulting engineer all came up on the side of open, interoperable industry standards such as those created by the OGC. None of them think a single standards body can do it all, but neither does OGC, which is why we use standards from W3C, IETF, OASIS, and ISO in our own work. Open GIS interfaces were a topic in many of the presentations as Canada continued its commitment to open, industry standard interfaces to drive interoperability." He added that "It is always nice to spend time on the exhibit floor at GeoTec as those in attendance are very well informed and more than willing to ask the hard questions."
ACD Systems, the developer of Canvass, an integrated illustration, image editing and page layout program, recently became and ESRI business partner. It did not announce any new products at the show but will unveil the next edition of Canvass early in the second quarter. Cadcorp promoted its CAD Spatial Information System (SIS) suite of products, emphasizing the number of certificates of compliance it had garnered. Intergraph participated in the show by demonstrating mobile resource management, geospatial infrastructure management, and land information management solutions based on its GeoMedia, IntelliWhere and TerraShare technologies. LizardTech used the show to launch its GeoExpress 5.0 with MrSID, image processing software. HP sent to the show a large contingent from its large format printing division, to show off the company's new Designjet 4000 Printer series. A sprited session on Web services, attended by more than 100 people, focused mostly on the consumer market, including Microsoft's MapPoint, the Keyhole service recently purchased by Google, Telcontar's engine and platform, and ESRI's ArcWeb hosted service.
ESRI also announced the availabity of the ESRI Developer Network, EDN (pronounced "Eden"), which it had launched a few days earlier at its Worldwide Business Partner Conference in Palm Springs, California, and ran seminars every half hour on ArcGIS 9. Its booth sported a 61 inch video monitor displaying its famous globe. Across from ESRI's booth, HP featured ArcPad field software on its rugged notebooks.
Finally, Brian Greening, of ESRI Canada, told me that it was a little hard to keep folks inside the building on Tuesday, because of the beautiful weather!

A Visit to the InfoGraphics Lab
.
IMAGES GALLERY
On February 22, I visited the InfoGraphics Lab at the University of Oregon, in Eugene. I was aware of the Lab's excellent reputation, but I wanted to see for myself and ask the staff many questions.
To find the Lab, which is only a few miles from my home, I used one of the campus maps it produced! Jim Meacham, a senior research associate and the Lab's administrative and research director, told me the Lab's story, which began in 1988 with the goal of bringing computer graphics and mapping capability to the university and to publish the second edition of the Atlas of Oregon (completed in 2001). At the time, the field of cartography was in transition in from manual methods to the use of computer-aided design (CAD) and then on to the emerging GIS technology.
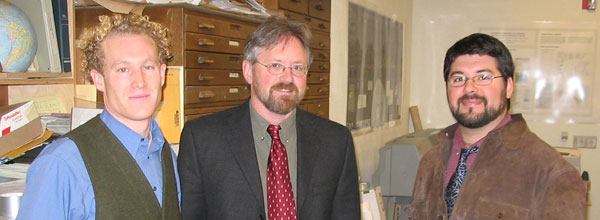
Erik Steiner, Jim Meacham, and Kenneth Kato
The Lab's CAD and GIS capabilities grew incrementally; it added ArcInfo in the early 1990s. From a single Unix workstation, the Lab's hardware grew over the years to more than a dozen PCs supported by three servers. For multiple user simultaneous file editing, the Lab uses ESRI's ArcSDE running on top of Microsoft's SQLServer 2000. Meacham pointed out that the Lab is not tied to any one software vendor, but integrates several software packages. This is both so that the Lab's staff can mix and match software, depending on the application, and so as to expose students to a wide variety of software.
Three Service Areas
The Lab has three areas of work: public service, such as research and mapping projects for state agencies; support for research by the university's faculty, including professors of geography, architecture, art history, and planning; and campus mapping, working with facilities planning, public safety, and other central services.
According to Meacham, the InfoGraphics Lab is unique in being a university GIS and cartography lab that has built bridges with so many academic and support departments. The Lab is a leader in atlas design, GIS, and cartography and is very proud of the awards garnered by the Atlas of Oregon.
The Lab is home to undergraduate and graduate students from several different academic departments. It gives them a chance to hone skills learned in their geography classes and prepare for the professional world. Among other projects, students have implemented a new ESRI geodatabase; gained skills in cartographic design, including map production, and in geographic databases, including building databases and using them for analysis.
According to Meacham, one advantage for the Lab of being in a university environment is that, like a small city, the campus of a large university is a great testing ground for GIS. Kenneth Kato, the Lab's project manager and a research assistant, goes further: because the Lab's campus work will not end at the expiration of a contract as is the case with most of the work done by professional GIS shops, he explains, it can continually refine its products. In this sense, he adds, the Lab's campus work is an ongoing program rather than a project. Like a small city, the university campus has needs in the areas of facilities and operations management. This allows the Lab to do two of the things it is really good at: mapping, which is the staff's real passion, and the GIS back-end, which makes maps come alive. While Kato acknowledges that it is fun to print thousands of copies of maps that people will use for a wide variety of purposes, he sees the increasing integration of the GIS data model and its output, cartography, as one of the Lab's key goals — as well as a trend in the geospatial industry.
For this reasons, when the concept of geodatabases went mainstream a couple of years ago, the Lab dove into this new area and decided that the campus — being a much more fixed entity than, say, agricultural land or an area of rapid urban growth — would be a great subject of its work. A further advantage of this choice is that the university campus is large enough to warrant installing and operating an enterprise system and to realize some of the technological advantages promised by geodatabases. In other words, to use a buzzword, the effort has a high ROI (return on investment). This is not the case for small organizations. While the size of the Lab itself would not justify the cost of an enterprise-level GIS, the size of the university, with all of its infrastructure, does.
However, Kato points out, the Lab is not solely the university's GIS shop; rather, it is part of the university's Geography Department. Rather than being housed in a central service — such as Facilities Services, which is responsible for the maintenance and repair of all campus buildings and grounds — the Lab is housed in an academic department, where its goal is to work at the cutting edge of technology and design and at the same time focus on researching new solutions to problems and teaching these techniques and methods to students.
Creating Geotopia
One of the key ideas behind geodatabases, which the Lab is promoting, is to house GIS data on a central server rather than in a collection of different databases. Before, Kato recalls, when it completed a project for a department, the Lab used to turn the data over to it. The department would then edit the data, fields, and definitions in the database and, often, other departments would also. Whenever the Lab was then asked to do another round of work on that database, it would have to start by normalizing the data and editing inconsistent definitions. Now, instead, the Lab maintains a single central database and builds the network that allows different departments to access the data. This capability includes multiple simultaneous access and editing to a single file. This is exciting and a pillar of the geodata model, says Kato: as the barriers to data access disappear, users approach that mythical state — geotopia!
Another reason why Kato and his colleagues favor this model is that it allows them to spend less time on data management and more on representation (again, cartography) and on supervising students in design iterations, which he thinks is the most useful education that the Lab can impart.
Previously, university departments relied on the Lab to do a large proportion of their mapping and GIS work, provide them with files, and give them technical support. Now, instead, the Lab tries to make itself the hub of the wheel, as Kato puts it. Rather than files and technical support, it provides connectivity.
Data management is one of the key ingredients of any large GIS. Though not as sexy as cartography, it is equally hard. Under the Lab's "hub & spokes" system, each department manages its own data in the central database, via the access that the Lab has set up for that department. Previously, Kato recalls, staff from the departments would give Lab staff annotated paper maps and the Lab staff would have to interpret the notes and edit the data accordingly.
When several university employees with two or three decades of institutional knowledge each were about to retire, their departments worked with them extensively to capture into the awaiting geodatabase the campus geospatial data that they possessed, in their heads and on paper. An example was one employee who had been in charge of subsurface conduits for a long time.
In producing a new edition of its campus map, the Lab rebuilt its GIS, Kato explained to me, thinking about the map and working backward. The map defined the extent of the GIS. "If we had only had a GIS perspective," Kato told me, "we would have clipped only data for University of Oregon property" and excluded adjacent areas. Instead, thinking about the final product, the map, led the team to include adjacent areas.
As cartographers, the Lab wanted to move from a line-based design to one based on polygons devoid of any gaps. Every pixel on the map represents something in the real world. Therefore, to better update the campus map a year and a half ago, the Lab began with aerial photography, to rebuild the geometry, then used polygons and topology rules to ensure that there were no slivers, overshoots, and dangles. Now, when builders snap utility lines to the Lab's campus map, they know that the files are up to date. To them, the sequence of updates is transparent and seamless. This is an example of what Kato describes as "a central system whose goal is decentralization." Another example is how the system benefits the university's telecom service.
The Lab created each building's footprint using digital orthophotography, remote sensing (to remove the lean, especially for a few tall buildings on campus), and plain old tape measures. The result, Kato assured me, was footprints with sub-foot accuracy relative to themselves. As for the buildings' interiors, the facilities staff, who need to map every inch of every room on campus, maintain CAD files. To the Lab's staff, instead, rooms are polygons in the GIS; however, their shapes agree perfectly with the CAD floor plans. Students working at the Lab combined the best files in ArcMap, then sent them to a couple of architecture students working for the university's facilities department, who created the polygons and the custom symbology.
Reports Go Lively
Using design ideas from the Atlas of Oregon, Lab staff now produce lively reports for Oregon state agencies that previously published mostly dry narratives. The Oregon Watershed Enhancement Board, for example, asked the Lab to redesign its annual report to look like the Atlas. The board deals with the politically sensitive issue of the possible de-listing of the Coho salmon under the Endangered Species Act. Lab staff, working side-by-side with scientists and policy analysts, aimed to take the most salient information and make it "easily consumable and geographically relevant," Kato told me.
Additionally, the Lab wanted to show the process through which the board arrived at its policy decisions. To this end, it produced a document detailing the issue, action, observation, interpretation, opportunity, and need at each end of the process and for each watershed. Starting from federal hydrological files, the Lab used a combination of algorithms, "mouse time," and subjective judgments to class each river segment. GIS did "the bulk of the heavy lifting," Kato explained, with regard to connecting the segments. Lab staff manually corrected misalignments that caused the GIS iterations to stop and used digital elevation models to derive the dimensions of bays. After all the segments were classed and connected, the staff used Macromedia Freehand and Adobe Photoshop to make the final fixes to the maps.
Erik Steiner, a research assistant, designer, and developer, is the Lab's expert on interactive mapping and other digital presentations. His job, he explained to me, is to translate the motive and skills behind a map produced for print publication to a map produced for digital display and user interaction. He describes his products as "light" simulations, for the general reader, of what a professional GIS analyst might do. These visualizations give users the flexibility to customize their displays according to their own needs, rather than taking the attitude that the cartographer knows best how the information should be displayed. One example of this is the work that Steiner's did for the Oregon State University (OSU) Natural Resources Digital Library.
In the best tradition of the visual display of quantitative and qualitative information, these interactive presentations (both of which are prototypes) distill mountains of data into a single tool. Steiner explains that the design objectives are less focused on displaying the results of a scientific study than on synthesizing the process of the science itself. Insight into the scientific process has a benefit that is often lost in the face of overwhelming amounts of geospatial data: it can empower both scientists and the general public to make more effective decisions. Ultimately, that is the greatest value of geospatial technology.
Letters to the Editor
.
The questions I raised last week have begun to bring in responses. I look forward to receiving many more!
Dimitri Rotow, product manager for Manifold System, wrote me a very provocative, article-length message. I reproduce here a few excerpts.
Regarding conflation:
The rise of low-cost, anyone-can-afford-it, GIS that includes sophisticated conflation and image fusion capability I think will make this a lot easier and more popular. What used to cost tens of thousands of dollars worth of software can now be done for under $250.
Regarding uncertainty in remotely sensed image classification:
I don't see this as a big issue for most users. It only affects those who are doing their own classification, which is an infinitesimally small percentage of the total GIS user population. Keep in mind that GIS is growing by about a factor of 100 or even 1,000 from the traditional legacy base. Most GIS users now use remote sensed images as simple backgrounds for context or illustrative purposes, not to do their own classification. That's not to say that people doing classification are somehow doing unimportant tasks, it's just remarking that statistically they make up less than 1/2 of 1 percent of the user base.
Regarding GRASS and other open source software:
GRASS is utterly barren, obsolete junk compared to a first rate modern system. It is, at best, a rehash of 1980s ideas about GIS revolving around a very limited idea of GIS as raster only. That's crazy, since in modern times you are not doing GIS if you don't do vectors and if you don't have very, very sophisticated database capabilities. For that matter, you need modern integration with things like Internet Map Servers (IMS), Microsoft development languages, neurofuzzy inferencing, co-mingling of rasters, vectors and terrain elevation surfaces in 2D and in 3D views and all those other modern things that constitute modern GIS as opposed to hobbyist tinkering with a leftover, failed Army development project.
Regardless of how anyone feels about it, 98 percent of the world uses Microsoft and if you don't wish to marginalize GIS Monitor to being something that two percent of people read, I think you'd grant the central importance of working within Microsoft technologies to the majority of those people who are prospects for your readership.
There are no open source GIS products out there of any merit. One reason is that Open Source advocates often put their politically correct instincts ahead of their common sense. So, they create products for operating system environments that (statistically) no one uses. If they wanted lots of people to actually use their products, they'd create them for Windows. However, one reason I believe many open source advocates do not create products for Windows is that deep down inside, no matter what they say publicly, they know that Windows is a ferociously competitive environment where users have very, very high expectations for user interfaces and product completion, and they know their open source product will look threadbare compared to very polished Windows products. So, rather than expose their work to an unflattering comparison, they tinker away in obscure operating system environments where the only other points of comparison are likewise limited.
Commercial products tend to be better than open source ones because when highly complex user interfaces and products involving thousands of capabilities are considered, open source communities have proven unable to muster the density of programmatic development capabilities equivalent to what commercial companies can focus on a project.
Open source advocates are fond of stating that they have the advantage of parallelization, applying lots of people each doing a small bit here or there, but that's not how elite software development works. It is possible to a degree to parallelize development of "black box" interface software in open source development efforts when you have a guide to what needs to be reverse engineered. That's why open source has been somewhat successful in reverse engineering the (obsolete) operating systems of the past such as the UNIX to Linux reverse engineering effort. UNIX or Linux, after all, are for the most part a collection of "black box" modules interacting with each other absent the benefit of a sophisticated user interface. That's OK for server applicances but lousy for the desktop.
But open source does not work at all well for applications requiring dense and sophisticated user interfaces. By their nature, such applications absolutely require extremely close interaction on a daily basis between the many people who craft them. That is very, very hard to accomplish in a diffuse open source environment, and it is impossible at all to accomplish at high speed in a diffuse open source environment. That's why those very few open source projects that have been done that involve sophisticated user interfaces have either been done at glacial pace by one or two people working very closely together, or they are really fake open source in that they are commercial projects done at a place like SUN but for competitive reasons released as open source. That is, SUN could not exist but for its commercial activities so the teams embedded within that commercial organization are really commercial teams operating as commercial teams do, not diffuse networks of open source volunteers.
Regarding national spatial data infrastructures:
There are lots of countries inventing yet more, invariably expensive, ways to keep their GIS data away from users. This usually involves spending zillions of dollars on overly-bureaucratized "clearinghouses" and other webstacles that are designed to make it impossible for ordinary citizens to get free data in a non-proprietary way.
If countries are really serious about providing GIS data, they take simple, low cost measures to make lots of data available to the widest user base possible: they make it available on free FTP sites that anyone can access. They don't do that because for the most part they support national monopolies like the Ordnance Survey in the UK and don't really want to make it easy for the public to get free access to public data.
GIS Monitor can be a force for good in this respect. When some bureaucracy comes up with yet another way to burn up millions of dollars creating means to prevent simple public access to public data, please point out the idiocy of their proposal in contrast to simply operating an FTP site from which data can be obtained.
Regarding the impact of the World Wide Web on the availability of GIS:
You've got it totally wrong. It's not Internet that's broadened usage of GIS, it is the ubiquitous availability of PC clones running Windows that anyone can afford coupled with the emergence of full-power, best-in-the-world GIS applications like Manifold that sell for under $250.
Nobody in their right mind does true GIS over the web any more than anyone in their right mind attempts to do things like Adobe PhotoShop or Adobe Illustrator over the web.
Regarding the challenge of encoding, transporting, and promoting data interoperability over heterogeneous Internet environments:
That's not a challenge at all since sophisticated GIS is always done better in distributed desktop environment. The above is only a challenge to those people who, for political/competitive reasons are trying to revive the idea of a "network PC" in competition to Microsoft based desktop environments.
Regarding the development of Geography Markup Language (GML) and the work of the Open GIS Consortium and the International Standards Organization (ISO), and whether they are "crucial":
No, they are not. They are absolutely irrelevant since less than 1/10th of 1 percent of GIS users buy into that idiocy. The great majority of GIS users are doing GIS in Microsoft environments on desktop boxes and they are completely ignoring both OGC and GML. The immense volume built by companies that focus on Microsoft and ridicule OGC will, over time, eliminate those companies who drank the Kool Aid of OGC. At that point, OGC will be totally irrelevant.
The money behind OGC largely exists as a somewhat failing effort to codify a set of obsolete technical standards to protect legacy companies from more modern competition. OGC is an anti-competitive organization at its roots.
GML is a format that has zero compatibility between different versions of GML as implemented by different groups, and which somehow manages to encode in 105 megabytes what a shapefile encodes in 5 megabytes. It is a format that only an inept bureaucrat would adopt, which is why, I suppose, one only finds it in use as a distribution format by the Ordnance Survey in the UK. And, even they have not been able to bring themselves to use pure GML, as they have found it is such an inept format that the only way to use it is to re-encode GML into a compressed form using .gz format.
Regarding whether I asked the right questions:
You missed the biggest question of all: what does the GIS industry look like when the inevitable sea change that has transformed other sectors in computer hardware and software transforms GIS markets?
In the 1980s'and 1990s people still bought minicomputers from the likes of DEC and Data General. Those companies were obliterated by the rise of mass-market PC clones like Dell.
In the 1980s people used "word processors" like Wangwriters and IBM Displaywriters for $15,000 a seat. Those products and all of the companies or business divisions selling them were obliterated by the rise of mass market, inexpensive word processing software running on desktop PCs.
In market after market, a sign that modern times have arrived is the application of inexorable economy of scale and PC clone / Wintel standards to drop the price per seat down below $250 and the eradication of minicomputer-era companies that sell their products for thousands of dollars per seat.
I really believe there is a market opportunity to sell GIS into truly mass markets. There are over three hundred million people today who use Microsoft Office on their Windows PCs. Of those, perhaps one hundred million people are more than intelligent enough to use GIS to explore, analyze and present data in a geographic context. Unless you have to deal with a crazily complex system like the stuff sold by legacy GIS vendors, there's no reason using a GIS to make cool maps and show data need be any more complex than creating a simple Excel spreadsheet or using Microsoft Word to make tables or format a document.
You can buy all of Microsoft Office Premium for under $500. That includes several major applications and a dozen or so minor ones, where all of the major applications are as sophisticated or more so than legacy GIS applications sold for $1000 to $5000. No one would accuse Microsoft of being a give-away, yet here they are selling intense, sophisticated applications for an average price of less than $100 per application.
Opening GIS to mass market economies of scale transforms the GIS community by increasing it a thousandfold or more in size. Obviously, many more people can buy and use full-featured GIS at $250 a seat than can at $5000 a seat. All those new people coming in from the Microsoft world bring with them many new ideas, and they tend to be a lot more demanding than legacy GIS users.
********
Rbert Fowler, who identifies himself as vice president of sales and marketing for a LiDAR services provider and says that he lives somewhere in Canadian cyberspace, wrote on the question of the location of the source of geological, biological, and cultural speciments in museums:
This is a significant problem for scientists, and in Canada where the history is known most specimens are located by relation to a rough position on the national topograpic maps.
Nowadays, of course, many field scientists do use GPS positioning to locate the geographic coordinates of what they have found. Years ago that technology just didn't exist, but today it often creates a problem. And, I fear, this is a growing problem in other areas.
In most cases the location of a specimen has important ramifications for other scientists, but, on the other hand, an approximate location, say to the nearest mile or half mile is probably good enough. And in some cases, it is probably better to leave some data out of the database.
For example, my wife works on the Canadian COSEWIC (Committee On the Status of Endangered Wildlife In Canada) and they often have difficulty in knowing quite how much information to release. If there are rare birds, animals, plants or whatever, and the location is known down to the meter, you can be sure many collectors will go out and try and add whatever it is to their personal collection. (It's sad, but true.) On the other hand, there are also political and social problems involved. If endangered plant life exists in a certain location, it's preferable to get the landowner on side to try and protect it further; so that he or she does not accidentally destroy the location - as in many cases landowners may not even be aware of an endangered species on their land. (In most cases, it should be said, landowners are pleased to be involved and feel significant in the protection of an endangered species, although there are always a few who will do the opposite for personal gain.) The same is true for cultural and geological artifacts. Protection of a site is often more important than the "general public's right to know."
So like many data, the problem is how much should be in the public domain? There are always people in any group who think everything should be public. On the other hand, let's face it, a lot of data are really of only limited interest to the average person and precise knowledge could be detrimental to a specific site.
Don't believe it? I live on 100 acres in the country and several years ago a sighting of a rare bird was reported in the local city newspaper specifying the approximate location (within a couple of miles) along our road. For two weeks we had literally hundreds of people walking all over our land with complete abandon, climbing fences and disturbing livestock, even parking in our laneway. Not a single one came and asked us permission.
There are indeed many things that should be open to public scrutiny. But despite a large fraternity who believe in open everything, I am not convinced any but the most coarse geographic data should be. Whether you like it or not, privacy is a significant issue. It's not just a matter of general privacy, but also security. It is relatively easy these days to find out quite a lot about anyone through "open databases" and even some that are not so obviously open. When those data are combined with other data such as the geographical position of where you live, you become at risk from many of the less desirable members of society. It is true a lot of these data are out there already (and this is whence much of the open database proponents present their arguments) but often they are not in compatible and easily assimilated forms, so why make it easier than it already is.
My firm belief is that databases of any kind, especially geographic, should not be open. They should be locked away and used by only those who have the authority and really need to use them (emergency services, for example).
News Briefs
.
Please note: I have culled the following news items from press releases and have not independently verified them.
ESRI will hold its third annual Survey and GIS Summit July 23-26 at the San Diego, California, convention center. The summit bridges the gap between surveying, engineering, and GIS technology and is intended for both those who are and those who are not users of ESRI technology. Topics covered will include land management, GPS technology, integrating survey data and GIS, survey and GIS technology case studies, implementing GIS, education programs, surveying and GIS integration, and geodetic control. The will summit coincides with the 2005 ESRI International User Conference and will include some conference events.
Smart Data Strategies, Inc., (SDS) of Franklin, Tennessee, has appointed Devon Humphrey as Central Regional Sales Manager, based in Austin, Texas, and Jim Miller as Western Regional Sales Manager, based in Denver, Colorado. Humphrey, who has a B.S. in geography, most recently was a Regional Technical Manager at Pictometry International. Miller, who has a B.S. in real estate, most recently worked for L-3 Storm Control Systems, Inc., as a Senior Sales Engineer/Business Development Manager. SDS provides software, data conversion services, professional integration services, and data maintenance services to the land records industry.
ER Mapper of West Perth, Western Australia, has released the source code to its ECW JPEG 2000 Software Development Kit (SDK). The SDK allows software developers to add support for large geospatial images in Enhanced Compressed Wavelet (ECW) and JPEG 2000 format to their applications. ER Mapper's ECW image format is used for large (multi-terabyte) geospatial images. JPEG 2000 is an ISO standard image format. According to the company, the release of the ECW JPEG 2000 source code is a major advance for the Open Source geospatial community and allows implementation of ECW JPEG 2000 on any desired operating system/platform. The ECW JPEG 2000 SDK and source are free to use for Open Source applications and projects. Commercial software products can use the free unlimited decompression/limited compression license, or pay a one time fee for unlimited compression/decompression.
Merrick & Company, of Aurora, Colorado, a provider of LIDAR, digital ortho imaging, photogrammetry and GIS mapping, has signed a contract with the Tallahassee-Leon County Interlocal GIS Organization (TLC GIS) of Tallahassee, Florida. Merrick will obtain new aerial photography, create color digital orthophotography, and update planimetric and topographic data, for delivery in December 2005. Merrick uses information derived from the city's and the county's processes for granting building permits and for reviewing subdivisions to identify areas of highest need and plan basemap updates.
The City of O'Fallon, Illinois, has selected Varion Systems, of Chicago, the software development and value-added reseller division of GeoAnalytics, Inc. to implement Govern Software's land management solution. The City will use Govern for Windows and GovMap, an embedded GIS application built by Varion Systems using ESRI technology. Varion Systems recently implemented a computerized asset management system for the city, which included managing their water, sanitary sewer, storm sewer, and transportation assets, and integration with the Joint Utility Locating Information for Excavators (JULIE). The company will now provide implementation services that include design and deployment of the system, property control data conversion, training, coaching, and long term product support.
American Electric Power (AEP), of Columbus, OH, the largest U.S. electricity generator, has selected DeLorme, of Yarmouth, Maine, to supply GIS software, street-level base map data, and GPS hardware for its field operatives. DeLorme is a provider of mapping products and technical solutions for the consumer and professional markets. AEP selected DeLorme for its XMap GIS software, which AEP staff will be using for data visualization, navigation, and access to aerial and satellite imagery. DeLorme is also providing its proprietary Earthmate GPS hardware for tracking and data collection.
ESRI Virtual Campus will be presenting a free, live seminar introducing ArcIMS, a solution for delivering dynamic maps and GIS data and services via the Web. The seminar, which is designed for ArcGIS users as well as novice and expert Web developers, will provide an overview of ArcIMS components and acquaint participants with ArcIMS tools for Internet map authoring, Web site design, and site administration. It will take place on March 3, at 9:00 a.m., 11:00 a.m., and 3:00 p.m. PST.
GeoLytics, Inc., of East Brunswick, New Jersey, a publisher of demographic and geographic data on disks, has released TelcoCD 2005. The CD contains demographic data organized by telephone area code, prefix code, and local calling area and the program allows mapping as well as the export of boundaries to ArcView or MapInfo.
TatukGIS, of Gdynia, Poland, has released TatukGIS Editor, the full version of the free TatukGIS Viewer. This desktop GIS editor supports all the formats, features, and functionality of the free Viewer, plus features to digitize/edit vector geometry and attributes, convert between vector file types, import/export attribute data, merge vector layers, build and correct topology, unions and splitting, clipping, and buffers. The Editor saves vector layers to SHP, GML, MIF, DXF, and DLG file types and to SQL geodatabase files. Like the free Viewer, the Editor can be used to create ASP.NET projects for Web publishing with the TatukGIS Internet Server.
MapInfo Corporation, of Troy, New York, a software company focused on location-based information, has acquired GeoBusiness Solutions Limited, based in Wendover, Buckinghamshire, U.K., a provider of location-based analytical and modelling services and software in the United Kingdom. GeoBusiness Solutions specializes in site location and customer analytics; its clients include Somerfield, The Post Office, Odeon Cinemas, The Rank Group, CB Richard Ellis, HBOS plc, Camelot, and TK Maxx.
EarthData, based in Washington, D.C., has signed a contract with the state of Indiana's Counter Terrorism and Security Council to complete a statewide GIS base map for the state, in cooperation with Indiana's 92 counties. The project, which will use all-digital technologies and 1'- and 6"-pixel resolutions to map approximately 36,600 square miles, is scheduled for delivery in 12 months. Aerial data acquisition will begin in a few days. Products will include "true" orthophotography (without distortion caused by feature displacement, such as building lean) over the downtown sections of major metropolitan areas, color-infrared orthophotography, a digital surface model, and a digital elevation model. EarthData is an airborne data collection, mapping, and GIS services organization.
Topcon's Survey and GPS Division, based in Livermore, California, a manufacturer of precision positioning technology, is providing assistance for rapid response disaster mapping operations in tsunami-affected areas of Sri Lanka. The company donated two GMS-100 backpack-style GPS receivers to MapAction, a non-profit organization based in the United Kingdom which uses GPS to produce real-time maps that can be immediately used for rescue and relief operations. Once these emergency operations are complete, the maps can be used for reconstruction planning.
On February 21 planes began to fly across Indiana skies, beginning in the south of the state, taking pictures as part of the 2005 Statewide Color Orthophotography Project, designed to create a base map to assist agencies at all levels of government. The Indiana Counter-Terrorism and Security Council is the state's lead agency for the project, which is being funded primarily through state and local homeland security grants. It will include more than 50,000 digital pictures to be taken from seven planes that will fly across the state every day for two months, weather permitting.
Sony Electronics has engaged Synergy Systems, LLC, a supplier of Global Positioning System (GPS) location and timing solutions, to distribute and support Sony's GPS semiconductor and OEM module products. Synergy Systems will exhibit Sony's single chip CMOS GPS receiver IC and modules at the GPS-Wireless conference in San Francisco, February 24-25. Sony's GPS product lineup includes the CXD2951 Single Chip CMOS GPS Receiver IC, the CXA3355 GPS RF Down Converter, and GPS modules.
Intermap Technologies Inc. has signed a distribution agreement with aerial photography and mapping specialist BlueSky International, based in Coalville, Leicestershire. BlueSky will become a frontline reseller throughout Britain of Intermap's NEXTMap Britain elevation datasets. The datasets provide height and contour data for England, Wales and Scotland; the data is used for flood mapping, pipeline routeing, mobile wireless network planning, and other applications.
BlueSky is a supplier of aerial imagery, satellite imagery, and other remote sensing technologies; it provides photogrammetry, GPS ground control collection, and 3D building models; and it markets a collection of geographic education products and digital and hard copy mapping products.
Intermap's NEXTMap Britain used airborne radar to map Great Britain electronically in 3D, capturing data every 5 meters with sub-meter vertical accuracy.
GIS Monitor Back Issues
Advertise with Us
You can reach more than 17,000 GIS professionals every issue by sponsoring GIS Monitor. For more information, email us.
Contact
Please send comments and suggestions to:
.
Matteo Luccio, Editor
GIS Monitor
Ultimate Map/GIS Directory — Your search is over!
GIS Monitor is published by:
GITC America, Inc.
100 Tuscanny Drive, Suite B1
Frederick, MD 21702 USA
Tel: +1 (301) 682-6101
Fax: + 1 (301) 682-6105
Subscribe/Unsubscribe
If you wish to subscribe or unsubscribe visit our subscription
page.
|